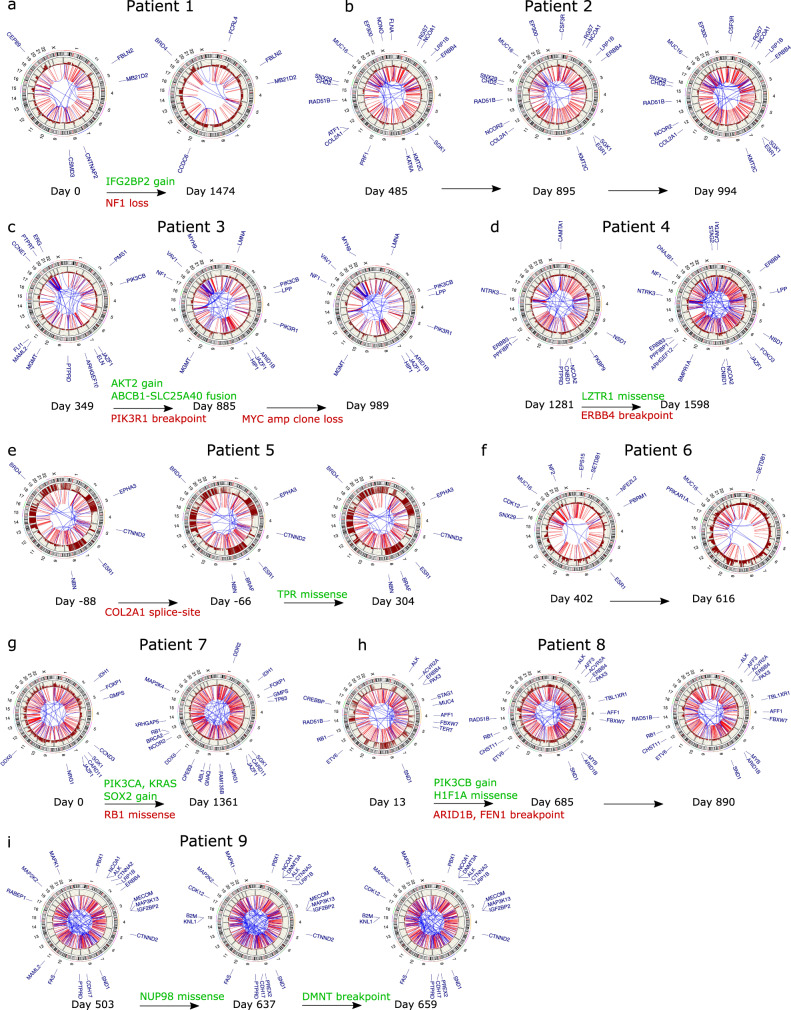
Fig. 6. Temporal genomic characteristics of ovarian cancer.
a–i Circos plots displaying breakpoints and CNVs along chromosomes. The breakpoints are displayed in blue, if within chromosomes, or red, if between chromosomes. Copy number gains along the outer track are shown in dark red, with losses indicated in blue and neutral copies in dark gray. The annotations at the periphery of the plots for the first time point of each patient indicate CNVs and SVs (breakpoints) affecting the exons of COSMIC cancer census genes. The plots for the subsequent time points are annotated to show only acquired CNVs and SVs, with truncal breakpoints shown in light gray.

