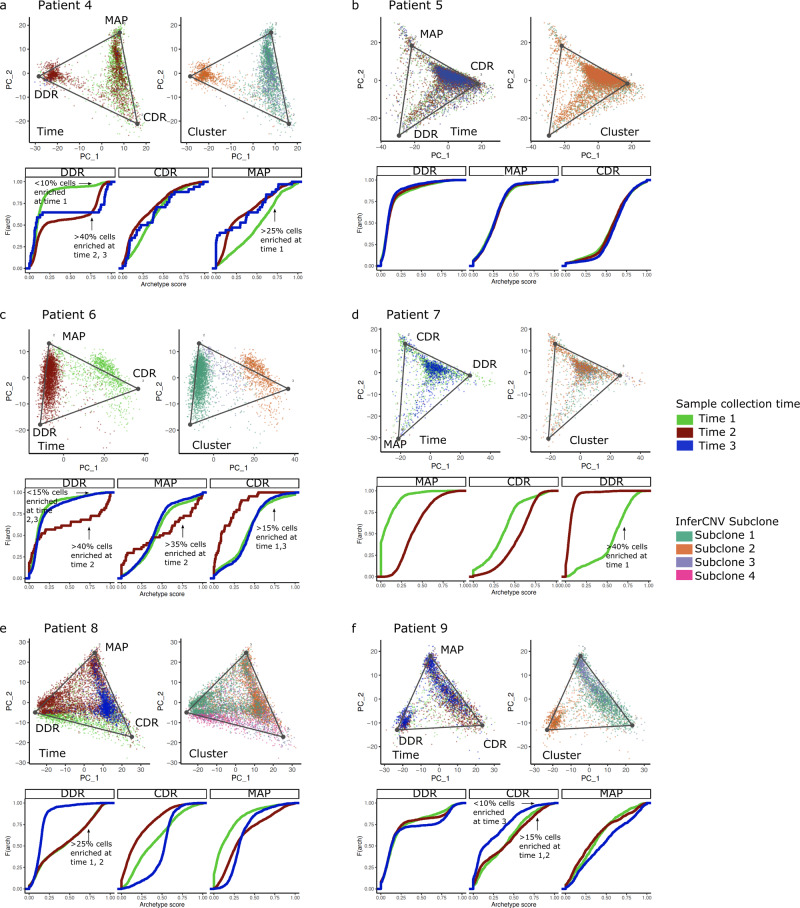
Fig. 8. Mapping archetypes to time and inferred subclones.
a–f The top two panels display archetypes on the first two principal components of each longitudinal cohort patient. The panel on the left shows archetype projections on cells colored based on sample collection time, while the right panel shows cells colored based on clusters identified using the inferred CNV algorithm. The empirical cumulative distribution functions of the archetype scores at each time point. Shifts in enriched archetypes, defined by an archetype score >0.8, are annotated on the plots.

