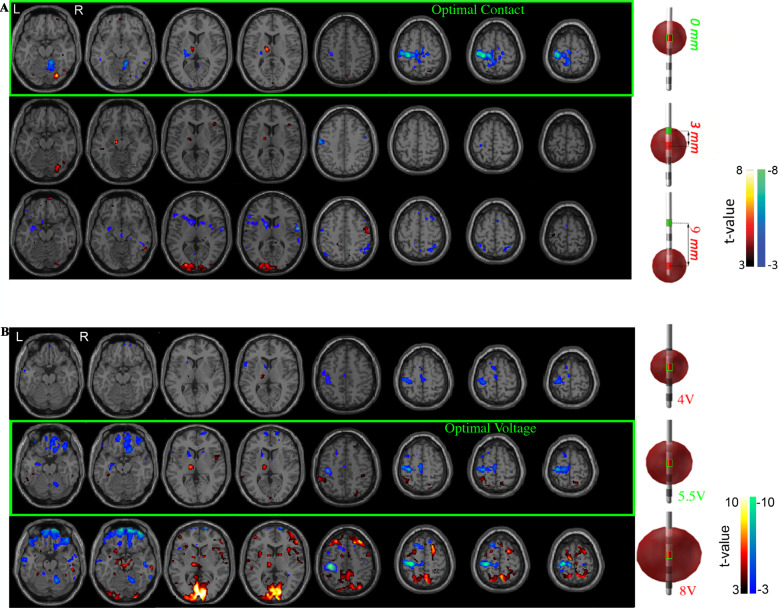
Fig. 3. Typical pattern of fMRI changes resulting from different settings.
BOLD response maps associated with left DBS-STN stimulation at multiple DBS lead A Contacts and B voltages for two a priori clinically optimized PD-STN patients. The fMRI BOLD signal changes at the optimal contact (A top row) and voltage (B middle row) are shown. Brain regions with a significant increase (hot colors, positive t-values, DBS-ON > OFF) and decrease (cool colors, negative t-value, DBS-ON < OFF) (p < 0.001, cluster size = 50) in BOLD response were identified. A The optimal contact showed changes in BOLD response in the left (ipsilateral) motor cortex and thalamus, and right (contralateral) cerebellum. We considered the clinically optimal contact as the origin (i.e., 0) and the non-optimal contacts were mapped as a function of distance in mm from the optimal contact. B When using the optimal stimulation contact, decreasing stimulation amplitude from optimal to low (subtherapeutic) voltage stimulation triggered a decrease in magnitude of the BOLD changes but maintained the topographic pattern. High (supratherapeutic) voltages produced a relatively stronger BOLD response in the left (ipsilateral) motor cortex and right (contralateral) cerebellum but was also accompanied by increased BOLD signal in non-motor regions such as the inferior frontal and occipital lobes. The subtherapeutic voltage was defined as 1.5 V below optimal voltage because a reduction of this magnitude yields a change in clinical status for most PD patients. The supratherapeutic voltage was defined as the voltage just below the side effects threshold (i.e., highest tolerated voltage). BOLD blood-oxygen-level-dependent, DBS deep brain stimulation, fMRI functional magnetic resonance imaging, PD Parkinson’s disease, STN subthalamic nucleus.

