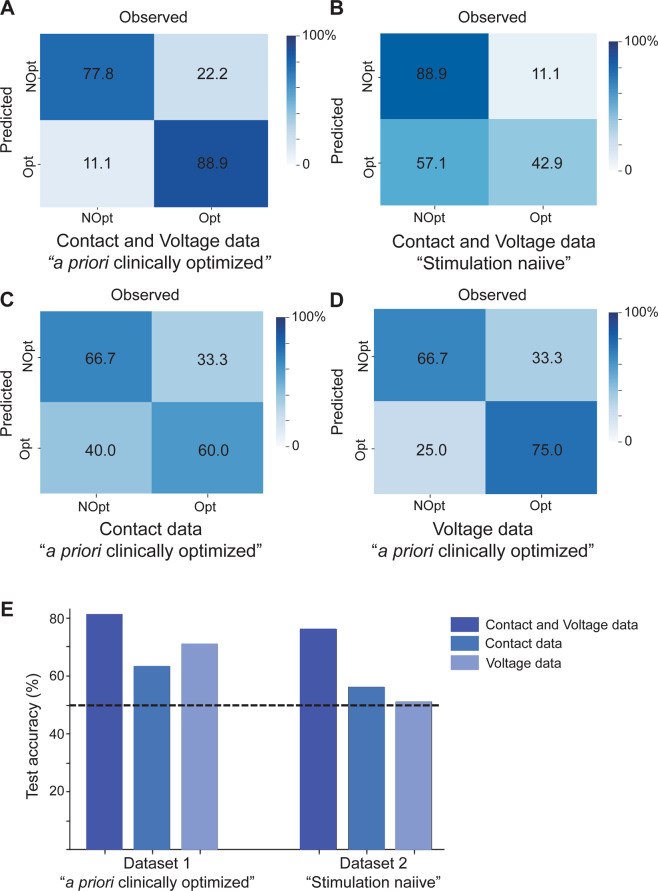
Fig. 5. fMRI responses predict optimal DBS parameters.
Confusion matrices depicting the performance of classifiers trained to identify optimal DBS settings using features from A contact and voltage cohorts, C contact cohort alone, and D voltage cohort alone in an independent test set (n = 9 a priori clinically optimized patients). B Confusion matrix depicting the performance of the classifier trained to identify optimal DBS settings using features from contact and voltage cohorts in an independent test set (n = 9 stimulation naïve patients). E Summary of performance (overall accuracy) for classifiers in A–D. Bars from dataset 1 depict classifier test accuracy on n = 9 a priori clinically optimized patients. Bars from dataset 2 depict classifier test accuracy on n = 9 stimulation naïve patients. Dashed line indicates chance at 50% accuracy. Source data are provided as a Source Data file. DBS deep brain stimulation, fMRI functional magnetic resonance imaging, NOpt non-optimal, Opt optimal.

