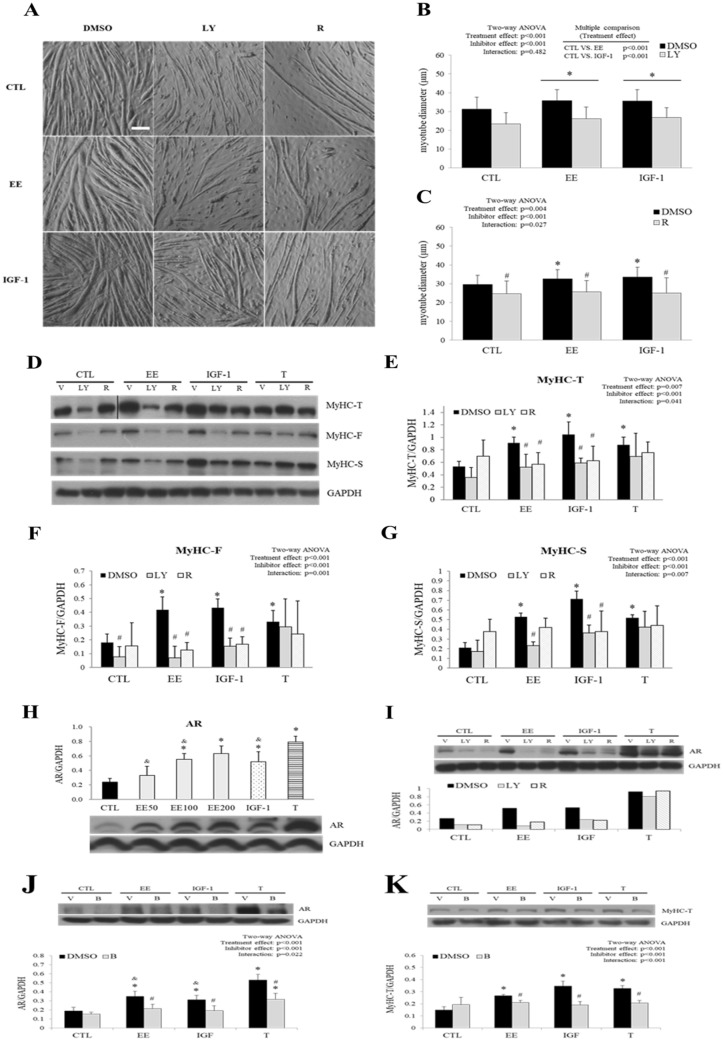
Figure 3.
PI3K and mTOR inhibitors abolished EE-induced myotube hypertrophy. Specific inhibitors LY294002 (LY, 10 μM), rapamycin (R 20 nM), or bicalutamide (B, 20 μM) were applied 30 min before EE (100 μg/ml), IGF-1 (20 ng/ml), testosterone (T, 500 nM) or control (CTL) treatment. DMSO (0.1%) served as the vehicle control (V). Differentiated C2C12 cells were maintained in serum-free medium and pre-treated with inhibitors or DMSO followed by indicated treatment for 24 h (western blot) or 48 h further (morphological analysis). (A) Representative photos were taken at the end of the indicated treatment by a light microscope (scale bar, 100 μm). (B,C) Myotube hypertrophy was determined by measurement of myotube diameter (N = 75/group). (D) The abundance of MyHC [total (T) as well as fast (F) and slow (S) isoforms] in cells treated with indicated regimen was detected by western blot, and the quantitative results are shown in (E–G) (N = 3–6). (H) The abundance of AR after treated for 24 h with EE, IGF-1, and T was examined with western blot. The effects of IGF-I inhibitor and T antagonist on AR were also detected in (I–K) (N = 3–5). All data were expressed as mean ± SD. The symbol * stands for p < 0.05 as compared to the basal (CTL or CTL-DMSO); the symbol # stands for p < 0.05 as compared to the intra-group DMSO treatment; the symbol & stands for p < 0.05 as compared to T or T-DMSO treatment.

