Figure 4.
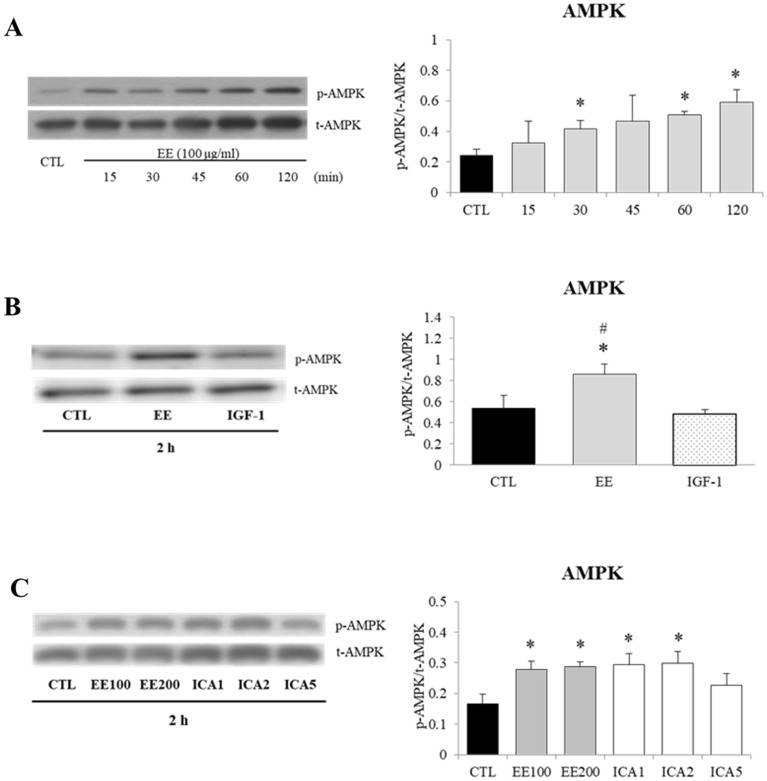
Effects of EE and ICA on AMPK/Thr172 phosphorylation. Differentiated C2C12 cells were starved in serum-free medium overnight before EE (100, 200 μg/ml), ICA (1–5 μM), and IGF-1 (20 ng/ml) treatment. Representative western blot images and corresponding densitometry measurements were shown and presented as phosphorylated/total protein ratios. (A) A time interval ranging from 15–120 min showed a sequential appearance of the phosphorylated AMPK induced by EE (100 μg/mL) (N = 5). (B) After a 2-h treatment, AMPK was activated by EE, but not by IGF-1 (N = 3). (C) ICA (1–2 μM) treatment induced a similar degree of AMPK phosphorylation as EE did (N = 3). All data were expressed as mean ± SD. The symbol * stands for p < 0.05 as compared to CTL, the symbol # represents p < 0.05 as compared to IGF-1.

