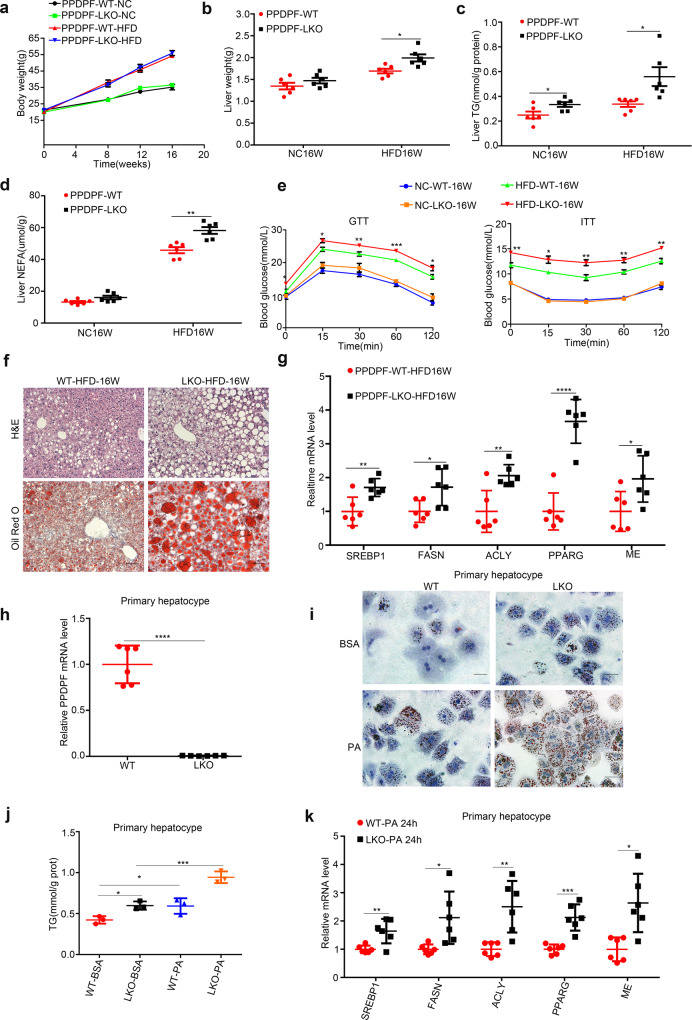
Fig. 2. PPDPF deficiency exacerbates HFD-induced hepatic steatosis.
Body weight (a) and liver weight (b) of WT(n = 6) and LKO (n = 6) mice fed a chow diet or HFD for 16 weeks. Mean ± SEM, *p = 0.01 by two tailed unpaired Student’s t test. The triglyceride (TG) (c) and nonesterified fatty acid (NEFA) (d) levels in the livers of WT and LKO mice at the end of 16 weeks of HFD feeding (n = 6 mice for each group). Mean ± SEM, (c) *p = 0.032 (NC16W), *p = 0.019 (HFD16W), (d) **p = 0.001 (HFD16W) by two tailed unpaired Student’s t test. e GTTs and ITTs are performed in WT and LKO mice after 20 weeks of NC or 21 weeks of HFD feeding (n = 6 in each group). Mean ± SEM. See Supplementary Data 1 for statistics. f Images of H&E and Oil Red O staining of liver tissues from WT and LKO mice fed HFD for 16 weeks. Scale bars, 100 μm. g The mRNA levels of lipogenic genes in the livers of the WT and LKO mice (n = 6 in each group). Mean ± SEM, SREBP1: **p = 0.006, FASN: *p = 0.019, ACLY: **p = 0.004, PPARG: ****p < 0.0001, ME: *p = 0.026 by two tailed unpaired Student’s t test. h PPDPF expression is measured by qPCR in primary hepatocytes. Mean±SEM, ****p < 0.0001 by two-tailed unpaired Student’s t test. i Oil Red O staining of the primary hepatocytes from WT and LKO mice exposed to 0.4 mM plamitic acid (PA). Scale bars, 100um. j Triglyceride quantification of the primary hepatocytes from WT (n = 3) and LKO (n = 3) mice exposed to 0.4 mM PA. Mean ± SEM, *p = 0.01 (WT-BSA Vs LKO-BSA), *p = 0.04 (WT-BSA Vs WT-PA), ***p = 0.002 (LKO-BSA Vs LKO-PA) by two tailed unpaired Student’s t test. k The relative mRNA levels of the indicated molecules in cells from WT (n = 6) and LKO (n = 6) mice. Mean ± SEM, SREBP1: **p < 0.005, FASN: *p = 0.015, ACLY: **p = 0.003, PPARG: ***p = 0.0002, ME: **p = 0.0049 by two-tailed unpaired Student’s t test. All experiments were repeated three times independently.

