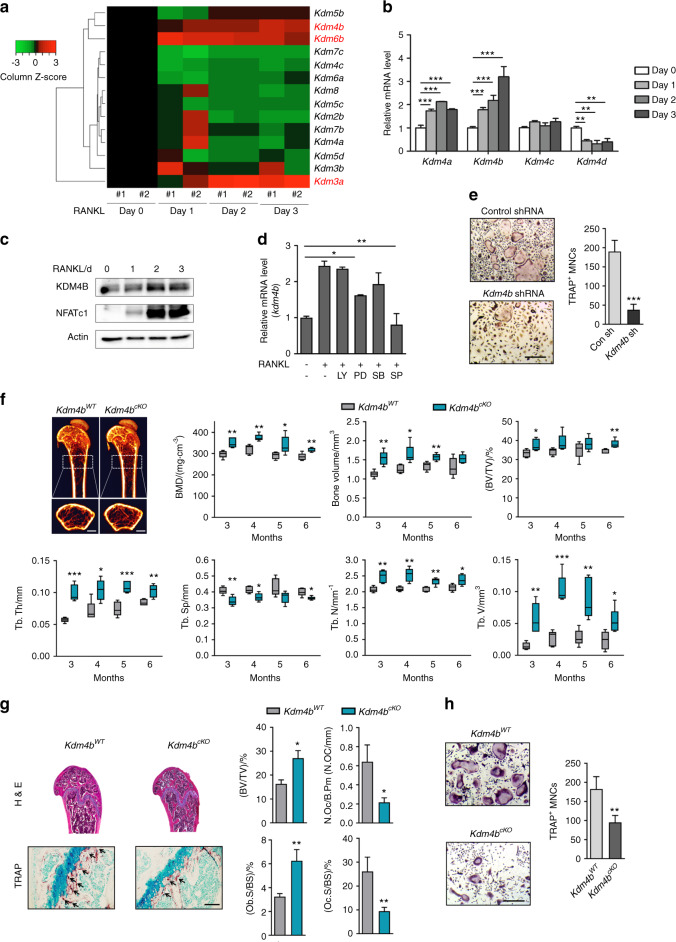
Fig. 1.
Myeloid-specific loss of KDM4B increases bone mass and reduces osteoclast activity in vivo. a Heatmap showing mRNA expression profiles of histone demethylases during osteoclastogenesis. b Relative mRNA levels of Kdm4a–Kdm4d during osteoclast differentiation. The mRNA levels of each reaction were normalized to the mRNA level of the β–actin control. c Immunoblot analysis of KDM4B expression levels during osteoclastogenesis. d Effects of protein kinase inhibitors on the mRNA expression of Kdm4b (LY, LY294002; PD, PD98059; SB, SB203580; SP, SP600125). e TRAP staining of BMMs expressing either control shRNA or Kdm4b shRNA. Scale bar, 75 μm. f Micro-CT analysis of the femurs of 3-month-old male Kdm4bWT and Kdm4bcKO mice (n = 5). Representative micro-CT image of the proximal femur (top, longitudinal view; bottom, axial view). The boxes enclose the 25th to 75th percentile values. The whiskers extend to the maximum and minimum values. The central horizontal bar indicates the median. Scale bars, 1 mm. g Histological analysis of femur sections from 3-month-old male Kdm4bWT and Kdm4bcKO mice (n = 3). The sections were stained for H&E and TRAP. The arrows indicate osteoclasts. Scale bar, 100 μm. h TRAP staining of BMMs from Kdm4bWT and Kdm4bcKO mice. Scale bar, 75 μm. The data are presented as the mean ± SD values of three independent experiments [two-way ANOVA in (b), one-way ANOVA in (d), two-tailed t-test in (e, h)]. In (f, g), the data are presented as the mean ± SEM values. *P < 0.05; **P < 0.01; ***P < 0.001. See also Supplementary Fig. 1

