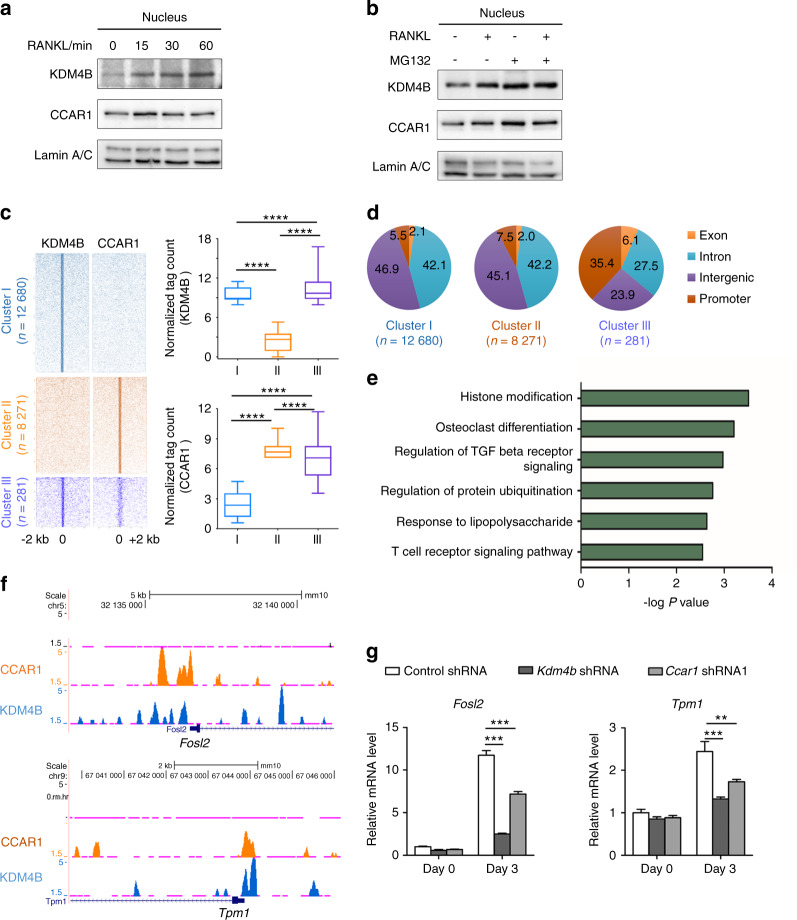
Fig. 3.
KDM4B and CCAR1 are colocalized near TSSs and enhance the gene expression of a set of osteoclast-related genes. a Immunoblots of nuclear fractions of BMMs after RANKL treatment. b KDM4B stabilization by RANKL or MG132. c Heatmap of normalized tag densities on KDM4B and CCAR1 peaks (left panels). Quantifications of tag counts are shown in the box plots (right panels). The boxes enclose the 25th to 75th percentile values. The whiskers extend to the 10th and 90th percentiles. The central horizontal bar indicates the median. ****P < 0.000 1 (Kolmogorov–Smirnov test). d Genomic locations of binding sites within each cluster are expressed as percentages of the total binding sites. e Gene Ontology (GO) enrichment analysis of Cluster III. f Representative UCSC Genome Browser tracks showing co-occupancy of KDM4B and CCAR1 at Fosl2 and Tpm1. g mRNA expression levels of Fosl2 and Tpm1 in cells expressing control shRNA, Kdm4b shRNA, or Ccar1 shRNA1. The data are presented as the mean ± SD of three independent experiments (two-way ANOVA). **P < 0.01; ***P < 0.001. See also Supplementary Fig. 3

