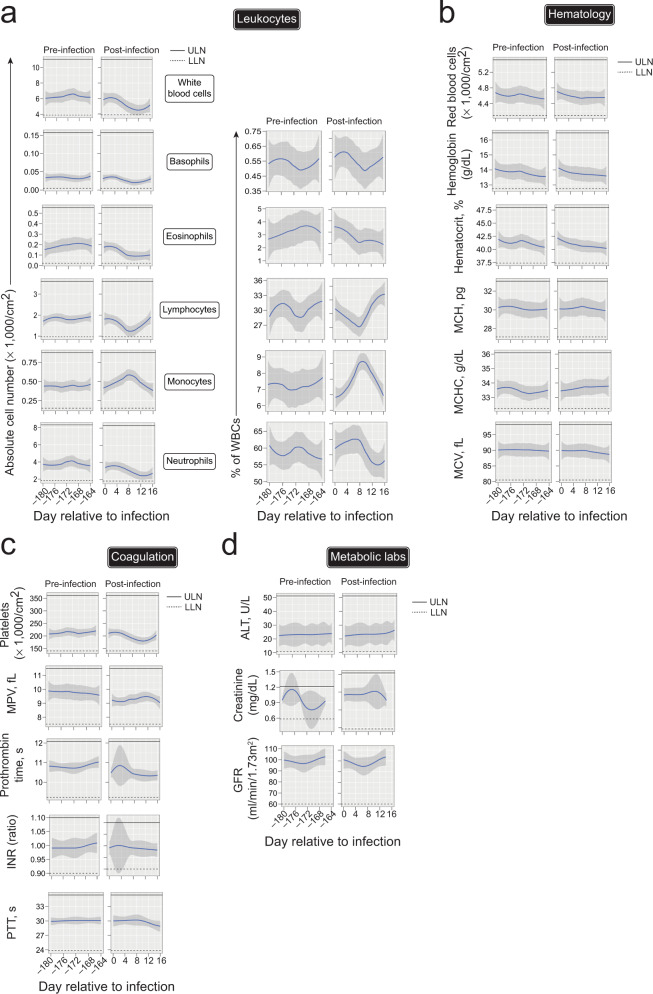
Fig. 2. Clinical laboratory assessment of rDEN2Δ30 infection.
a Leukocyte populations expressed as absolute counts, (×1000 cells/cm2, left) and as a percent of white blood cells (right) are shown for study visits occurring every other day over two ~2-week periods: 6 months preinfection and after infection of flavivirus-naive healthy volunteers (n = 11) with rDEN2Δ30, including day of infection. b Hematology labs, including red blood cell counts, serum hemoglobin, hematocrit, mean corpuscular hemoglobin (MCH), MCH concentration (MCHC), and mean corpuscular volume (MCV) are shown for pre- and post-infection as in (a). c Coagulation labs, platelet counts, mean platelet volume (MPV), Prothrombin time, international normalized ratio (INR), and partial thromboplastin time (PTT) are shown for pre- and post-infection as in (a). d Metabolic labs including alanine aminotransferase (ALT), Creatinine, and glomerular filtration rate (GFR) are shown for pre- and post-infection as in (a). Data shown for all subjects are shown as non-parametric LOESS (LOcal regrESSion) smoothing. All data also plotted by individual subject in Source Data. ULN upper limit of normal (solid lines), LLN lower limit of normal (dashed lines). For all panels, LOESS-smoothed lines and 95% confidence intervals are shown. Source data are provided as a Source Data file.

