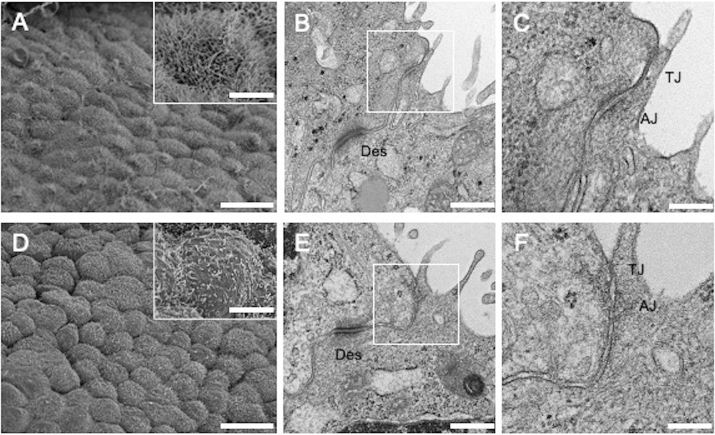
Figure 1.
Electron microscopic photographs of visceral pleura from PSP and BHDS patients. (A–C) Show PSP and Figures (D–F) show BHDS (n = 3 for both PSP and BHDS). (A,D) are SEM images. (B,C,E,F) Are TEM images of cell–cell junctions. The insets within (A,D) are magnified views of PMCs. (C,F) Are the magnified views of the areas indicated by white rectangles within (B,E), respectively. Scale bars represent 20 μm (A,D), 5 μm (the insets within A,D), 500 nm (B,E) and 200 nm (C,F). AJ adherens junction, Des desmosome, SEM scanning electron microscope, TEM transmission electron microscope, TJ tight junction.

