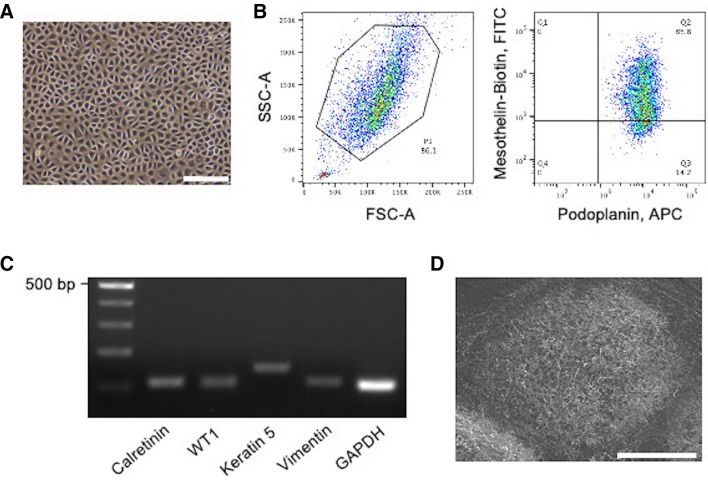
Figure 2.
Isolation and characterization of human PMCs from pleural lavage. (A) Representative photomicrograph of confluently growing cells obtained from pleural lavage in PSP patient. (B) Representative fluorescence-activated cell sorting dot plots of cultured cells. The left panel shows plots of the forward-scattered (horizontal) versus side-scattered (vertical) axes. The right panel represents the fluorescent intensities of APC (conjugated with the anti-podoplanin antibody) and FITC (conjugated with the biotinylated anti-mesothelin antibody), respectively. The Q2 area indicates the gateway for sorting PMCs (podoplanin-positive and mesothelin-positive cells). (C) The expression of MC markers (calretinin, WT1, keratin 5, and vimentin) examined in PSP-PMCs by RT-PCR. GAPDH was amplified as a control gene for RT-PCR. Gel electrophoresis of amplified products showed a discrete band with expected fragment size from each reaction. (D) SEM image of PSP-PMCs showing numerous microvilli characteristic of MCs. Scale bars represent 200 μm (A) and 20 μm (D), respectively. APC allophycocyanin, bp base pair, FITC fluorescein isothiocyanate, FSC-A forward scatter area, GAPDH glyceraldehyde 3-phosphate dehydrogenase, SSC-A side scatter area, WT1 Wilms’ tumor 1.

