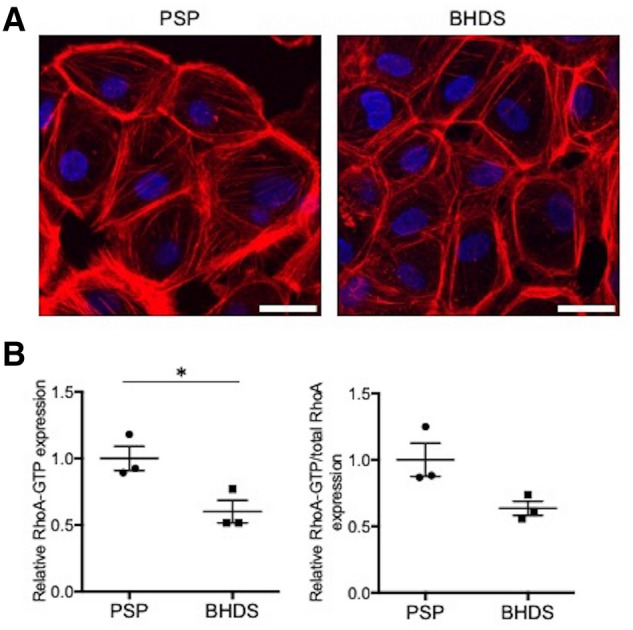
Figure 5.

Comparison of F-actin formation and RhoA activity between PSP- and BHDS-PMCs. (A) Representative confocal photomicrographs of phalloidin staining in PSP- and BHDS-PMCs (PSP, n = 3; BHDS, n = 3). At passage 1, 3 × 10⁵ PMCs were seeded onto a 35 mm glass-bottom dish until the cells became confluent. Scale bars represent 20 μm. (B) Plot of the levels of active RhoA-GTP and total RhoA. The vertical axis in the left plot indicates the relative RhoA-GTP expression when normalized by the mean level of RhoA-GTP in PSP-PMCs. At passage 1, 3 × 10⁵ PMCs were seeded on a collagen-coated 6-well plate, cultured until approximately 70% confluence, and then utilized for the measurement. The vertical axis in the left panel indicates the relative ratio of RhoA-GTP when normalized by the mean level of RhoA-GTP in PSP-PMCs. The vertical axis in the right plot indicates the relative ratio of RhoA-GTP/total RhoA when normalized by the mean level of RhoA-GTP/total RhoA in PSP-PMCs. The circles and squares indicate the measured values of each sample (PSP, n = 3; BHDS, n = 3) and the central horizontal lines indicate the position of mean values. The data are shown as mean ± SEM. * = p < 0.05 (unpaired t-test).
