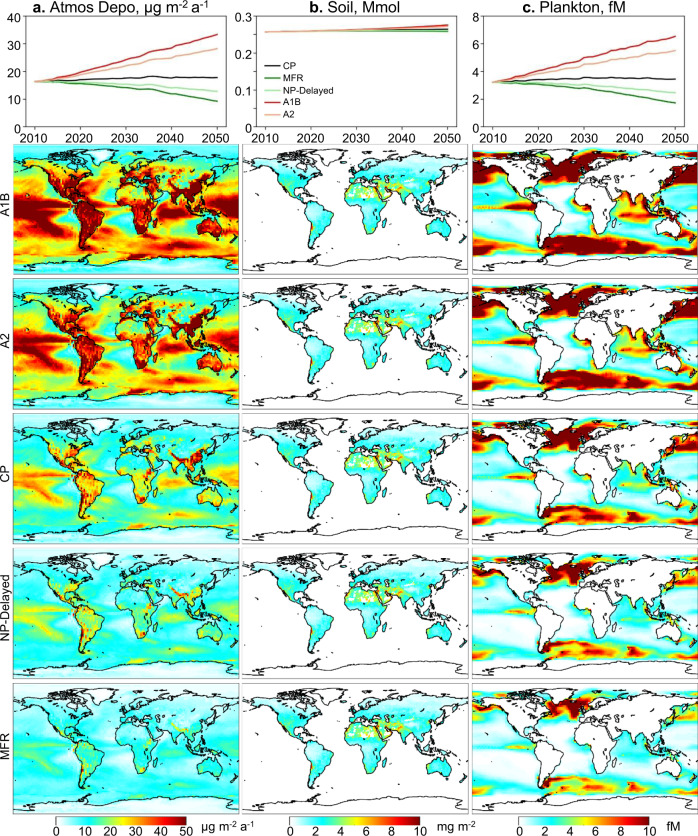
Fig. 3. Projected mercury levels in the environment in 2050.
The column (a), (b), and (c) is for atmospheric deposition, soil, and marine plankton, respectively. For each column, the top panel shows the trend of global mean values, while the lower panels are the spatial distribution for the five scenarios (with emission from highest to lowest): A1B (business as usual), A2 (divided world scenario), CP (current policy), NP-Delayed (new policy delayed), and MFR (maximum feasible reduction).

