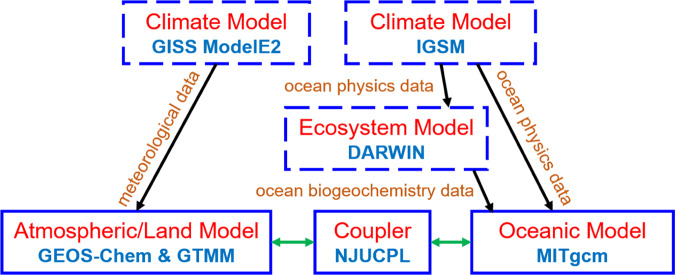
Fig. 6. The model framework used in this study.
Blue boxes represent models while arrows indicate data flows. Models with dashed boxes are run by previous studies and we directly use their archived output, while those with solid lines are run in this study. Black arrows mean feeding of archived data from one model to another (i.e., models are run separately), while green arrows mean running two models simultaneously with online data exchange.

