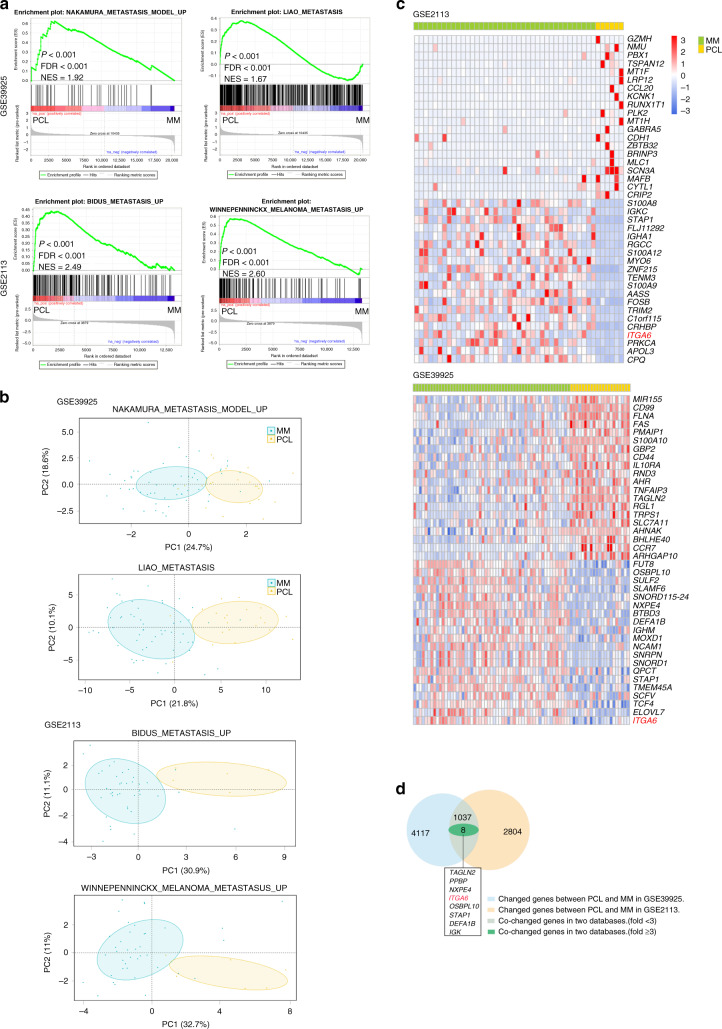
Fig. 1. ITGA6 may regulate the progression of MM to PCL.
a Specific gene expression signatures were associated with cell metastasis. Representative GSEA plots illustrating the enrichment of genes involved in positive regulation in PCL samples. FDR false discovery rate, NES normalised enrichment score. GSE2113 (MM n = 39, PCL n = 6), GSE39925 (MM n = 55, PCL n = 21). b Principal component analysis (PCA) plot showed unsupervised clustering, demonstrating a clear distinction between MM and PCL samples in each pathway. c The 30 up- and downregulated genes in PCL versus MM were presented in heat maps. d Venn diagram showing the overlapping differentially expressed genes identified in the two groups.

