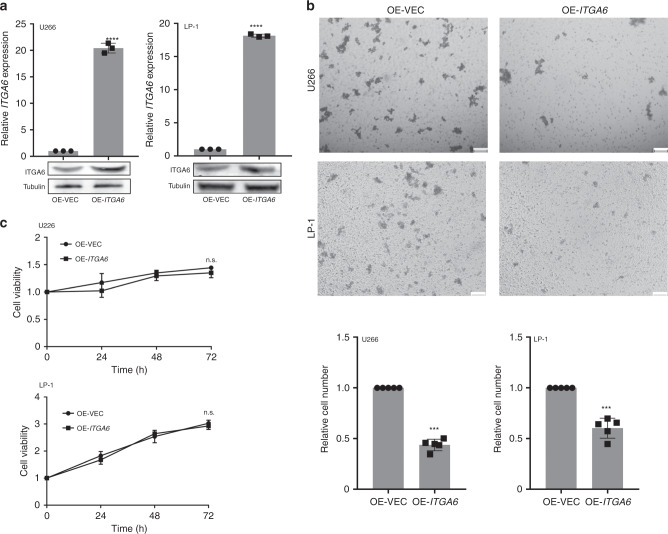
Fig. 3. ITGA6 mediated MM cell invasion.
a MM cells were transiently transfected with ITGA6 overexpression vector or empty vector. The levels of ITGA6 were analysed by qPCR and western blot. OE-VEC overexpression empty vector, OE-ITGA6, overexpression of ITGA6. qPCR results are shown as the means ± SDs from three independent experiments (n = 3). b Upper: Transwell assays were performed to evaluate the invasion of U266 and LP-1 cells overexpressing ITGA6. Scale bar = 100 μm. Lower: statistical graph indicating the number of cells averaged from 5 random high-power fields. The results are presented as the mean ± SD from three independent experiments (n = 3). c Cell proliferation in U266 and LP-1 cells overexpressing ITGA6 was measured using CCK-8 assays. **P < 0.01, ***P < 0.001, ****P < 0.0001, ns not significant versus control cells (n = 3).

