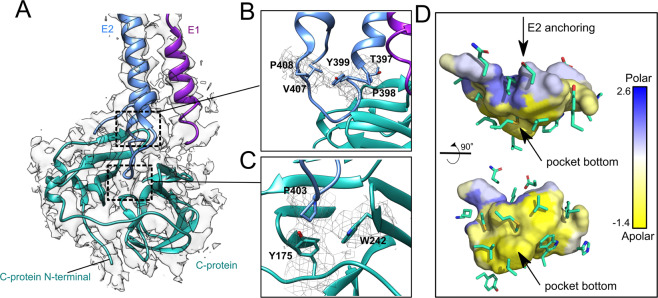
Fig. 7. MAYV capsid interaction with E2 C-terminal domain.
A MAYV 3D atomic model fitted into the cryo-EM density map. C-, E1 and E2 proteins are represented as cyan, purple, and blue cartoon, respectively. B The TPY motif (residues T387, P398 and Y399) interaction with the C protein. C P403 and T402 from E2 and their interaction with aromatic residues Y175 and W242 in C protein. MAYV density map is shown in mesh representation. D Cavity prospection in MAYV C-protein showing a hydrophobic environment in the pocket bottom and a polar and charged environment at cavity outer edges. C-protein cavity that binds E2 C-terminal is in surface representation and is coloured based on the Eisenberg consensus hydrophobic scale. C-protein residues surrounding the cavity are represented as sticks.

