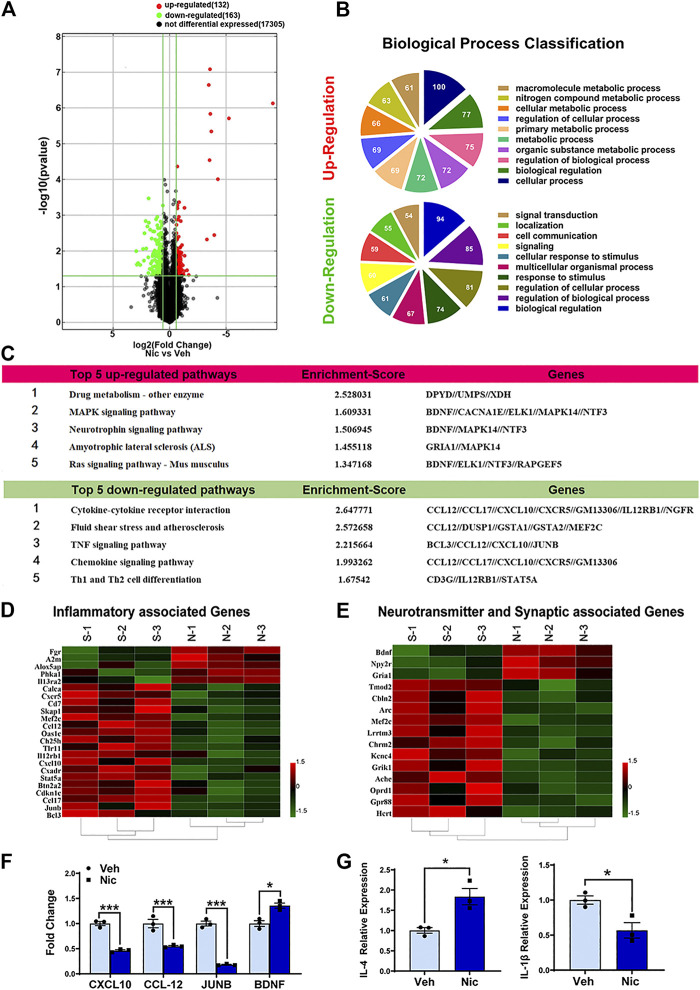
FIGURE 3.
Bioinformatic analysis of the expression profiles in 20 day old offspring’ hippocampus. (A) The distribution of mRNA profiles was illustrated by volcano plots. There are 295 differentially expressed genes. “Red” indicates high relative expression, and “green” indicates low relative expression. (B) The pie chart showed the top 10 significant enrichment terms represented by the biological process. Larger sectors represent more significant enrichment. Varieties of biological functions were expressed differently after maternal nicotine exposure in the hippocampus of the PND20 mice, as compared to the vehicle control. (C) The top five upregulated and downregulated pathways in which hippocampus differentially expressed genes involved were listed. Hierarchical clustering heatmaps of inflammatory genes (D), neurotransmitter, and synaptic associated genes (E) were generated using HEML software. (F) Confirmation of the microarray results, the expression of TNF and neurotrophin signaling pathway-related genes were validated by quantitative real-time PCR. (G) The representative genes of different inflammatory responses, IL-4 and IL-1β, were detected by quantitative real-time PCR. The columns represent the log-transformed median fold changes in expression relative to the vehicle group. *p < 0.05, all data are means ± SEM.

