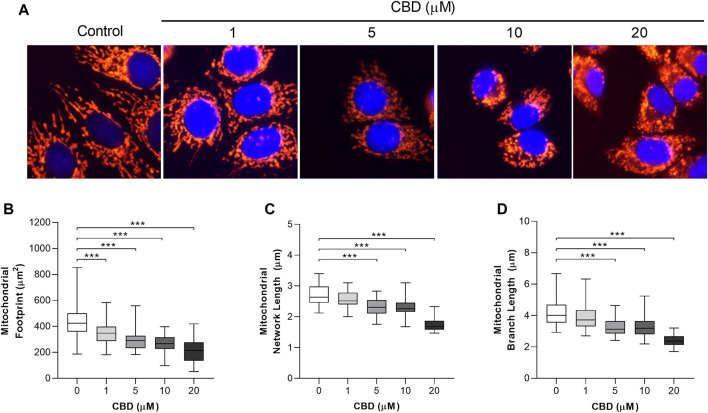
FIGURE 2.
In vitro effects of cannabidiol on mitochondrial morphology. (A) Representative images showing changes in mitochondrial morphology 24 h posttreatment with CBD (1, 5, 10, and 20 µM) or the control (DMSO). Cells were stained with MitoTracker Deep Red and NucBlue (ThermoFisher, United Kingdom) and imaged using the ThermoFisher EVOS FL2. (B–D) Box plots showing the effect of CBD on (B) mitochondrial footprint, (C) mitochondrial network length, and (D) mean mitochondrial branch length. Box shows median with 25th and 75th percentiles, and whiskers indicate minimum and maximum values. n = 45/group; *** = p < 0.001; data were analyzed by one-way ANOVA with Dunnett’s test for multiple comparisons using GraphPad Prism (United States).

