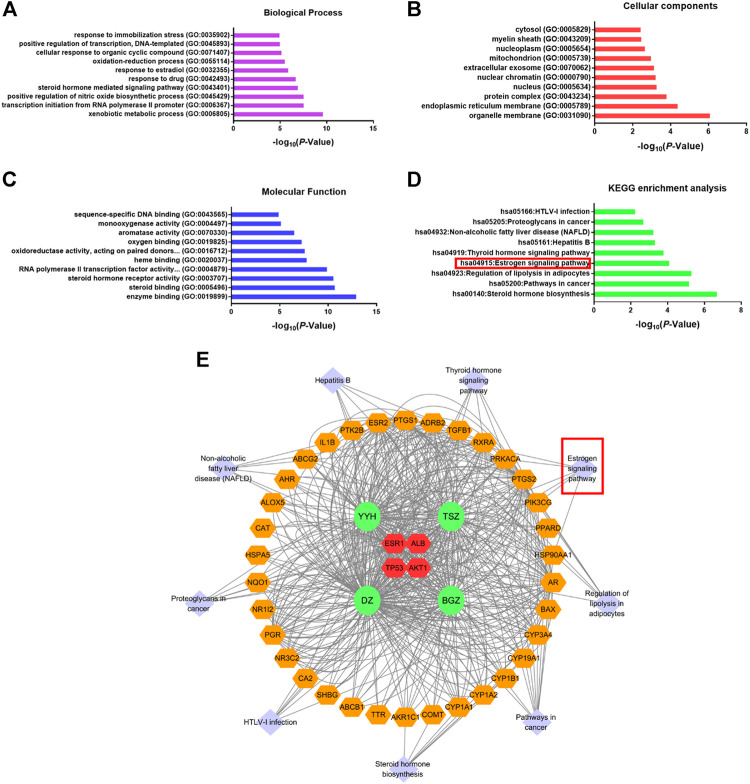
FIGURE 2.
Gene ontology and KEGG enrichment analysis. Gene ontology analysis of 38 cross-talking genes was displayed in 3 modules, including (A) biological process, (B) cellular components, and (C) molecular function. (D) KEGG signaling pathway enrichment analysis. (E) Pathway-herb-cross-talking genes network. The orange hexagon represents the same as in Figure 3. The light purple diamond represents the pathways enriched by 38 cross-talking targets. The green circle represents the herb.

