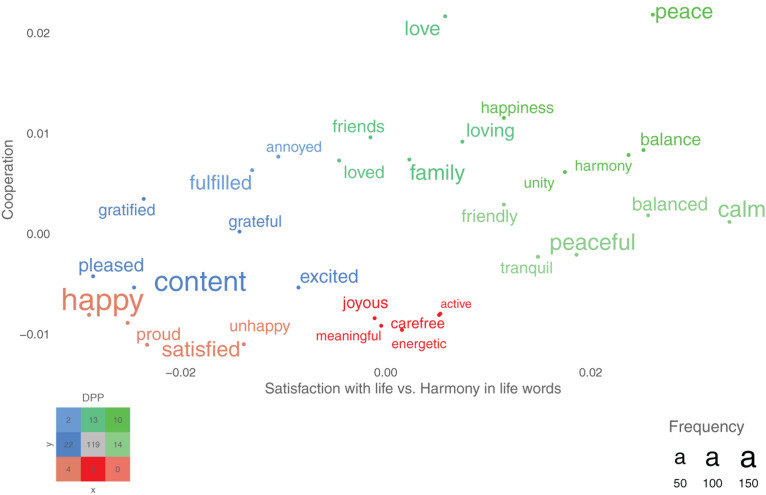
FIGURE 2.
A supervised dimension projection plot of words significantly differing between responses to the satisfaction with life and the harmony in life (x-axis) and the level of cooperation (y-axis). The colored legend in the lower left corner indicates the color and number of significant words in each part of the figure (for example, there are 10 light green words that are significantly high on both the x-axis and y-axis). N = 180.

