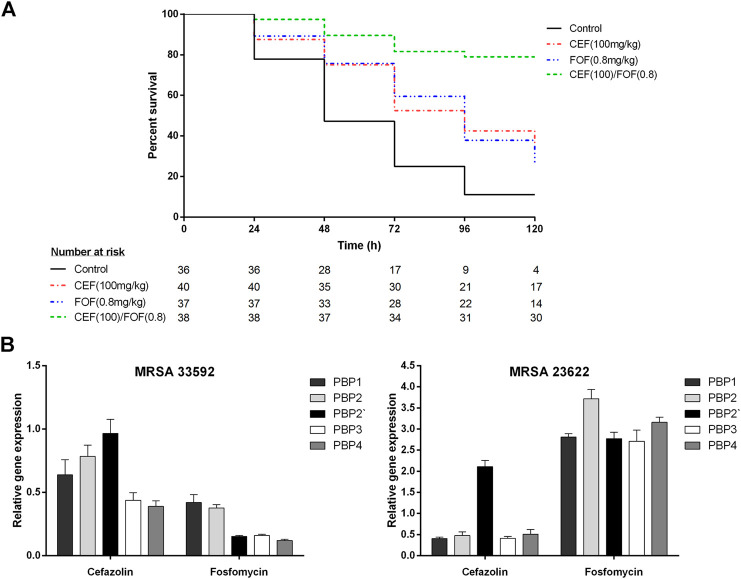
FIGURE 1.
(A) Survival curves of G. mellonella larvae infected with methicillin-resistant Staphylococcus aureus (ATCC-33592) followed by treatment with cefazolin (100 mg/kg), fosfomycin (0.8 mg/kg) or the combination of both (cefazolin 100 mg/kg plus fosfomycin 0.8 mg/kg). Curves represent the pooled data of two experiments performed on separate days. (B) Relative gene expression of penicillin binding proteins (PBP1, PBP2, PBP2′, PBP3, and PBP4) determined for one fosfomycin-susceptible (ATCC-33592) and one fosfomycin-resistant (DSMZ-23622) methicillin-resistant Staphylococcus aureus (MRSA) isolate using RT-PCR with gap as housekeeping gene and a no treatment control as reference. Bacteria were exposed to either cefazolin or fosfomycin at a concentration corresponding to 0.25 times of their respective minimum inhibitory concentrations for a time period of 4 h. Data is stated as mean (±SD) relative quantification values. *CEF, cefazolin; FOF, fosfomycin; MRSA, methicillin-resistant Staphylococcus aureus; PBP, penicillin-binding protein.

