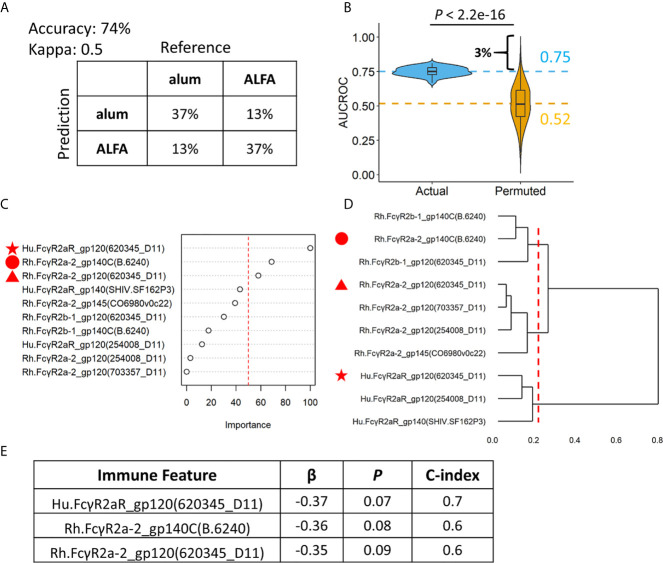
Figure 4.
Random forest models revealing individual level differences between ALFA and alum. (A) Prediction accuracy, kappa, and confusion matrices. The rows of confusion matrices represent the predicted adjuvant arms, whereas the columns indicate the actual adjuvant arms. (B) Comparison of AUCROC values from 100 repetitions of 100 times repeated 5-fold cross-validation using actual (blue) versus permutated (yellow) adjuvant labels. Dashed line represented the mean AUCROC values. (C) Immune feature importance in random forest models. (D) Hierarchical clustering on immune features used in random forest models. (E) Cox regression analysis on three most important immune features identified by random forest models.

