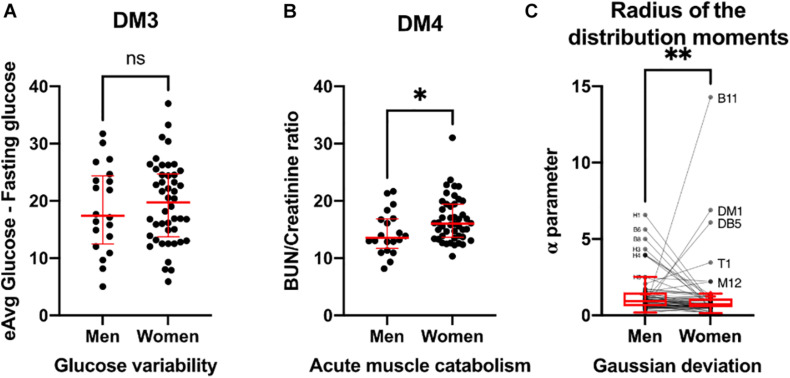
FIGURE 11.
Biomarkers of variability. Glucose variability (A), assessed by estimated average glucose minus fasting glucose is presented as individual values (black) with median ± 95% CI (red). Acute muscle catabolism (B), and hydration state are summarized by BUN/creatinine ratio and presented as individual values (black) with median ± 95% CI (red). Deviation from Gaussian distribution (C) calculated as the radius of the distribution moments for each physiological variable is shown as individual values (black) and Tukey’s box-plots showing median and interquartile range. Physiological variables with visible separation from Gaussian behavior are labeled. Statistical significant difference is indicated by ∗ if p < 0.05, ∗∗ if p < 0.01 and ns for no difference (p > 0.05).

