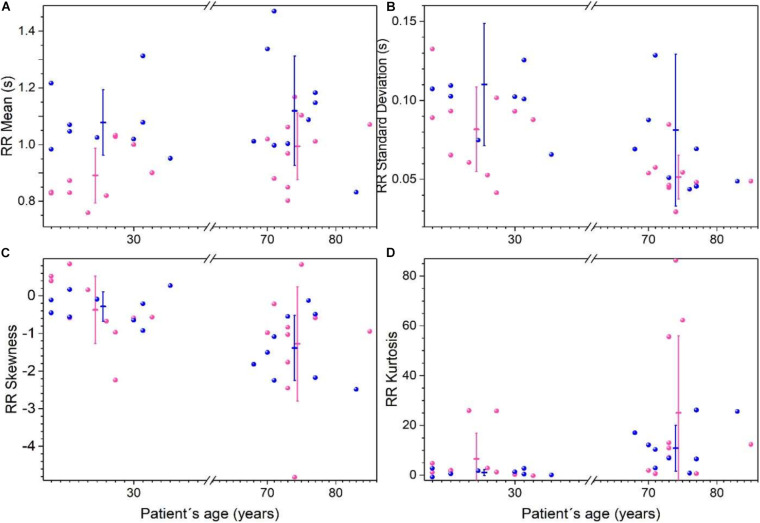
FIGURE 3.
Statistical moments of time series of the RR heartbeat intervals from Physionet’s Fantasia database. Each point corresponds to data from a women (pink) or men (blue) subject. For each group (women, men, young, and old) the mean of each parameter ± the standard deviation is plotted for RR average (A), standard deviation (B), skewness (C), and kurtosis (D). (Adapted from Lavin-Perez and Rivera, 2018).

