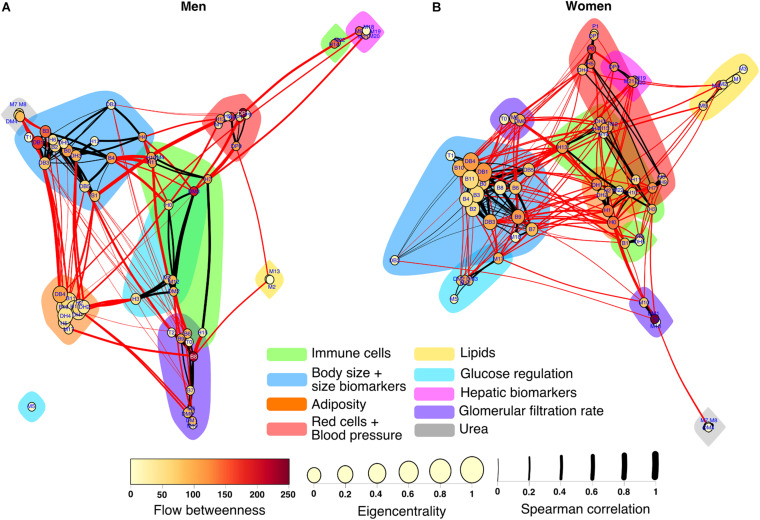
FIGURE 6.
Physiological networks of men and women. The physiological network of men (A) and women (B) are represented using a Linlog force-directed model. Node size indicates the eigencentrality and node color the flow betweenness. Color clouds show nodes clustered together using the Louvain algorithm. Link width represents the strength of the Spearman correlation between physiological variables. Intercluster links are highlighted in red, whereas intracluster links are black.

