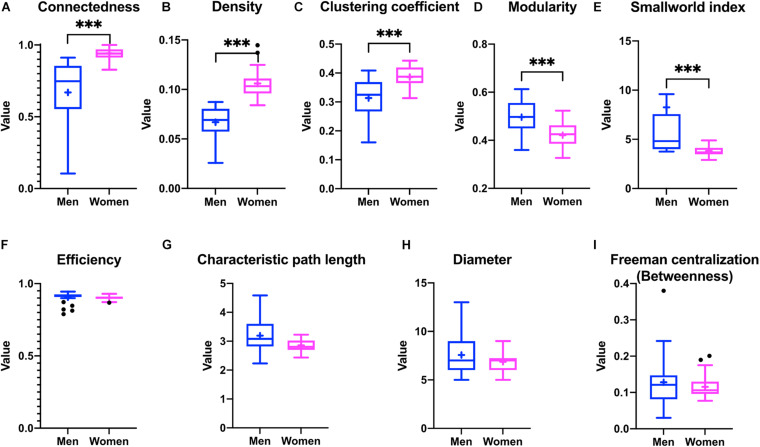
FIGURE 7.
Differences in the topological characteristics of the networks for men and women. Differences in connectedness (A), density (B), clustering coefficient (C), modularity (D), smallworld index (E), efficiency (F), characteristic path length (G), diameter (H), and betweenness Freeman centralization (I) are shown between the physiological networks of men and women. Statistical significant difference is indicated by ∗∗∗ if p < 0.001.

