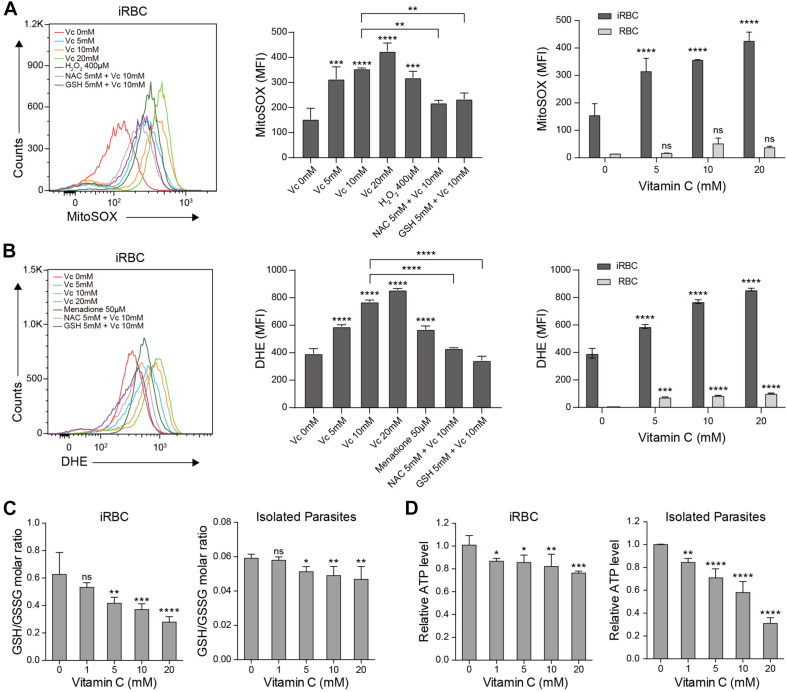
FIGURE 3.
Vitamin C causes oxidative stress in P. berghei–infected RBCs and parasites. (A) Vc induced mitochondrial superoxide production in a dose-dependent manner in P. berghei–infected RBCs, which could be reversed by the antioxidants N-acetyl cysteine (NAC) and glutathione (GSH). Left: Representative FACS plots of superoxide production in iRBCs. Middle: Quantitative superoxide production in iRBCs (n = 3/group). One-way ANOVA was performed to detect statistical differences. Right: Quantitative superoxide production in both iRBCs and RBCs (n = 3/group). Differences between Vc-treated iRBCs/RBCs and non-treated iRBCs/RBCs were analyzed by two-way ANOVA with Tukey multiple comparisons. (B) Vc induced superoxide production in a dose-dependent manner in P. berghei–infected RBCs measured by DHE, which could be reversed by NAC and GSH. Left: Representative FACS plots of superoxide production in iRBCs. Middle: Quantitative superoxide production in iRBCs (n = 3/group). Right: Quantitative superoxide production in both iRBCs and RBCs (n = 3/group). (C) Vc treatment decreased the GSH/GSSG ratio in P. berghei–infected RBCs (left panel) and isolated P. berghei parasites (right panel) (n = 5/group). (D) Vc decreased ATP production in P. berghei–infected RBCs (left panel) and isolated parasites (right panel) (n = 5/group). Based on calibration, the ATP concentrations of the tested samples derived from iRBCs and isolated parasites treated with 0 mM Vc are 5.40 ± 0.33 μM and 0.72 ± 0.003 μM. One-way ANOVA was performed to analyzed the results in (C, D). All data are presented as mean ± SD and are representative of at least three repetitions. *P < 0.05, **P < 0.01, ***P < 0.001, ****P < 0.0001, and n.s., not significant.

