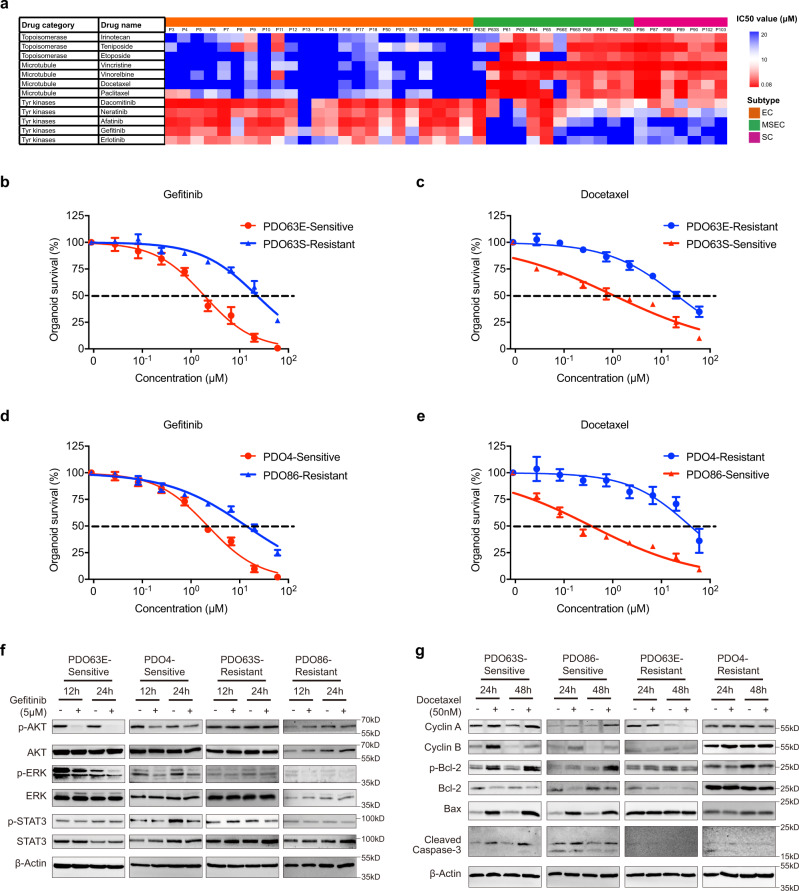
Fig. 4. Drug treatment on patient-derived organoids (PDOs).
a Heatmap showing subtype-specific drug responses (IC50 values) of topoisomerase (irinotecan, teniposide and etoposide), microtubule (vincristine, vinorelbine, docetaxel and paclitaxel) and EGFR (dacomitinib, neratinib, afatinib, gefitinib, and erlotinib) inhibitors on 42 NPC PDOs. b Representative gefitinib response curves on sensitive MSEC-derived organoids PDO63E and resistant MSEC-derived organoids PDO63S. c Representative docetaxel response curves on sensitive MSEC-derived organoids PDO63S and resistant MSEC-derived organoids PDO63E. d Representative gefitinib response curves on sensitive EC-derived organoids PDO4 and resistant SC-derived organoids PDO86. e Representative docetaxel response curves on sensitive SC-derived organoids PDO86 and resistant EC-derived organoids PDO4. Sensitive drug response curves (b–e) are presented with red color, and resistant curves (b–e) are labelled with blue color. Data points (b–e) represent mean % viability relative to control ± SEM, for n = 3 biological replicates. Graphs (b–e) are representatives of 3 independent experiments. f, g Western blot analysis on EGFR downstream proteins (f) of gefitinib sensitive organoids PDO63E and PDO4, and resistant organoids PDO63S and PDO86; Mitotic checkpoint and apoptotic proteins (g) of docetaxel-sensitive organoids PDO63S and PDO86, and resistant organoids PDO63E and PDO4. Blots are representatives of two independent repeats. Western blot analysis demonstrated by more PDO samples are shown in supplementary Fig. 9a,b.

