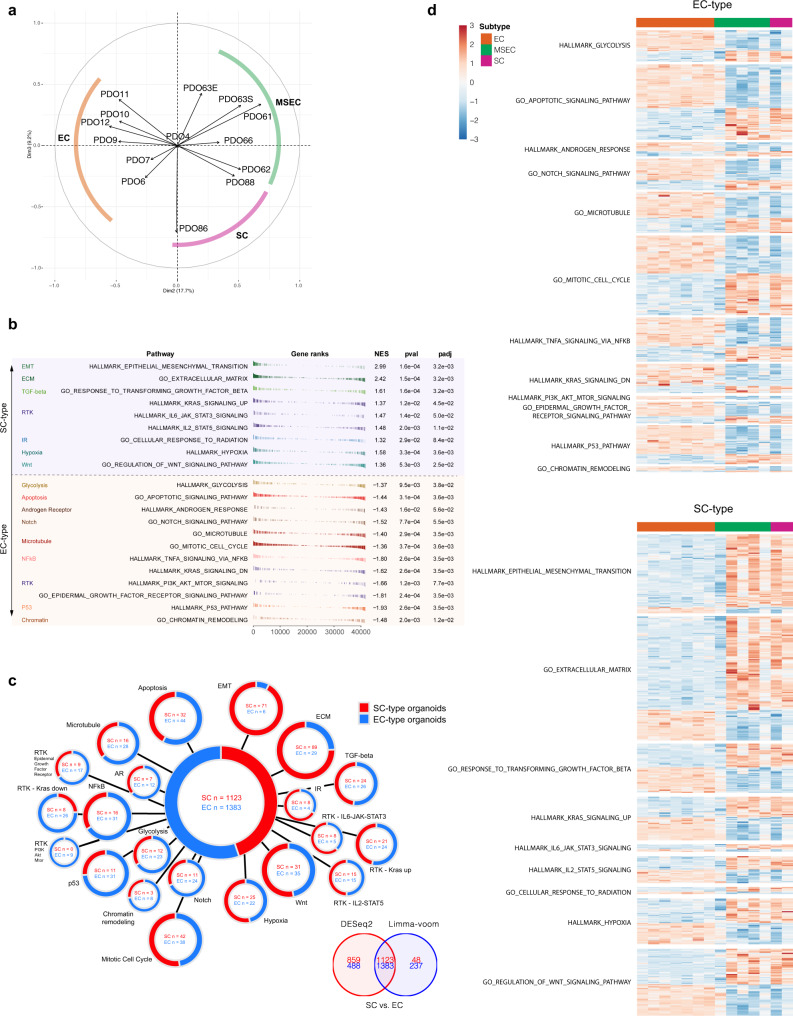
Fig. 6. Subtype-specific driver pathways revealed by transcriptional analysis.
a Unsupervised clustering by principal component analysis (PCA) on sample-wise PDO transcriptome. Organoids derived from the same subtypes were well clustered into the corresponding subtypes. b Top differentiated pathways between EC-type and SC-type PDOs according to GSEA enrichment analysis. c Upregulated signature genes in EC-type organoids (blue) and in SC-type organoids (red) overlapped by DESeq2 and Limma-voom. d Heatmap showing expression of differentiated signature genes between EC-type and SC-type organoids.

