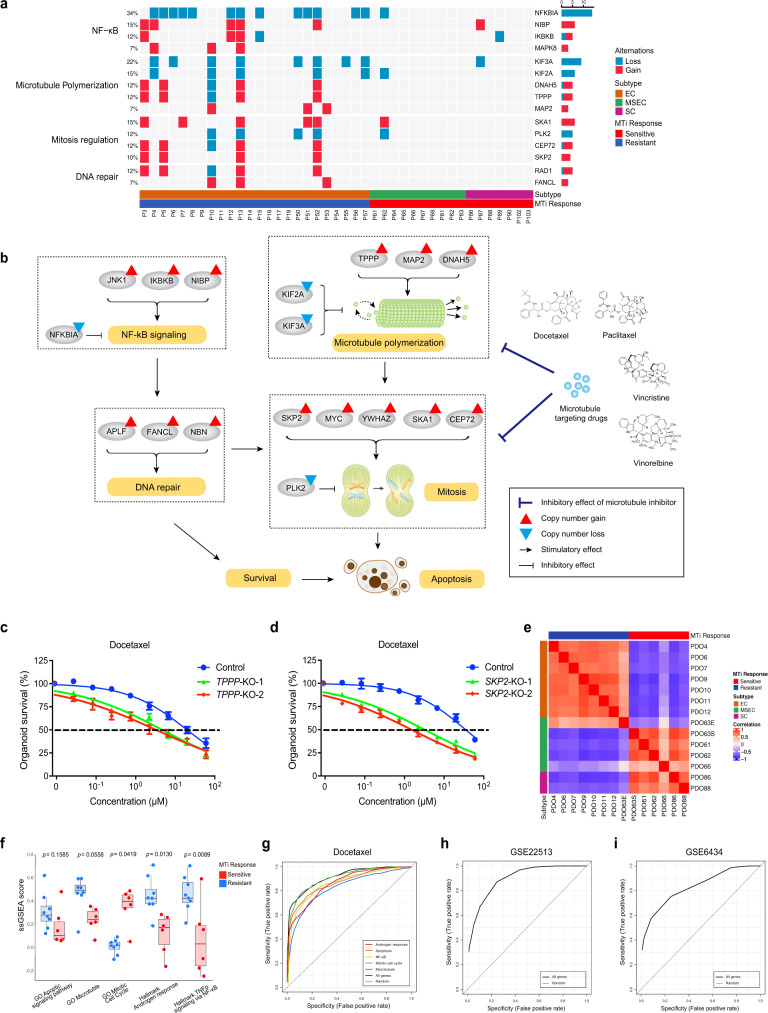
Fig. 7. Pharmacogenomics-based precision medicine.
a Subtype-specific CNVs illustrating microtubule inhibitor response mechanism involving in NF-κB signaling, microtubule polymerization, mitosis regulation and DNA repair. b Microtubule inhibitor resistance in P13 associated with CNV involving in mitosis regulation, microtubule polymerization, NF-κB signaling and DNA repair. c TPPP knockout in PDO9 overcome docetaxel resistance. d SKP2 knockout in PDO4 overcome docetaxel resistance. Drug response curves (c, d) are presented with blue color for nontargeting control, green and red color for gene knockout groups. Data points (c, d) represent mean % viability relative to control ± SEM, for n = 3 biological replicates. Graphs (c, d) are representatives of three independent experiments. e Correlation heatmap of NPC subtypes versus docetaxel response based on 105 signature genes from five pathways essential to drug mechanism, including GO apoptotic signaling pathway, GO Microtubule, GO Mitotic cell cycle, Hallmark Androgen response, and Hallmark TNFα signaling via NF-κB. f Boxplots representing ssGSEA scores of docetaxel-sensitive and resistant PDOs on five key drug mechanism-related pathways. Boxplots represent median levels, first and third percentiles. Whiskers indicate 1.5× inter-quartile range (IQR) extending from the hinges. Statistical significance was calculated using two-sided t-test, the p values regarding comparison between sensitive and resistant groups for each pathway are presented. n = 14, including six sensitive samples and eight resistant samples. g Receiver operating characteristic (ROC) curves illustrating estimated docetaxel prediction accuracy using signature genesets of five key correlated pathways, including all genes (black, area under curve (AUC) = 0.918), GO apoptotic signaling pathway (orange, AUC = 0.876), GO Microtubule (blue, AUC = 0.83), GO Mitotic cell cycle (green, AUC = 0.914), Hallmark Androgen response (red, AUC = 0.866), Hallmark TNFα signaling via NF-kB (yellow, AUC = 0.864). h ROC curve illustrating estimated paclitaxel prediction accuracy using all signature genes from five key pathways (black, AUC = 0.914) on GSE22513 dataset of human breast cancer patients. i ROC curve illustrating estimated docetaxel prediction accuracy using all signature genes from five key pathways (black, AUC = 0.841) on GSE6434 dataset of human breast cancer patients.

