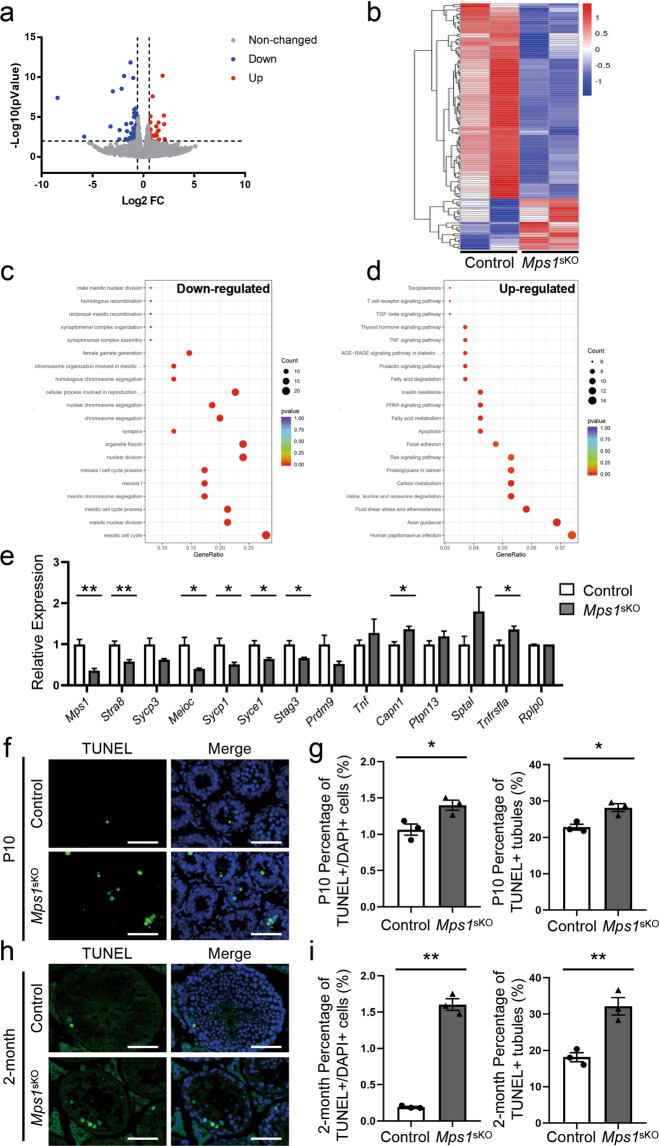
Fig. 6. Loss of Mps1 altered the expression of genes involved in meiosis and caused abnormal apoptosis in seminiferous tubules.
a Gene expression pattern in Mps1sKO testes compared with control testes at P10. An FC > 1.5 and a P value < 0.01 were used as the cut-offs. b Heatmap of the DEGs between control and Mps1sKO testes at P10. In total, 92 genes were downregulated, and 24 genes were upregulated. An FC > 1.5 and a P value < 0.01 were used as the cut-offs. c Top 20 GO terms for the downregulated DEGs. An FC > 1.5 and a P value < 0.01 were used as the cut-offs. d Top 20 KEGG terms for the upregulated DEGs. An FC > 1.2 and a P value < 0.05 were used as the cut-offs. e qPCR analysis of DEGs involved in meiotic biological processes and apoptosis in Mps1sKO testes at P10. Student’s t test; n = 3; *P < 0.05. f Immunofluorescence staining of TUNEL in control and Mps1sKO testes at P10. g Statistical results for the percentage of TUNEL-positive cells among DAPI-positive cells per tubule and the percentage of TUNEL-positive seminiferous tubules in control and Mps1sKO testes at P10. n ≥ 3; *P < 0.05. h Immunofluorescence staining of TUNEL in control and Mps1sKO testes at 2 months of age. i Statistical results for the percentage of TUNEL-positive cells among DAPI-positive cells per tubule and the percentage of TUNEL-positive seminiferous tubules in control and Mps1sKO testes at 2 months of age. n ≥ 3; **P < 0.01.

