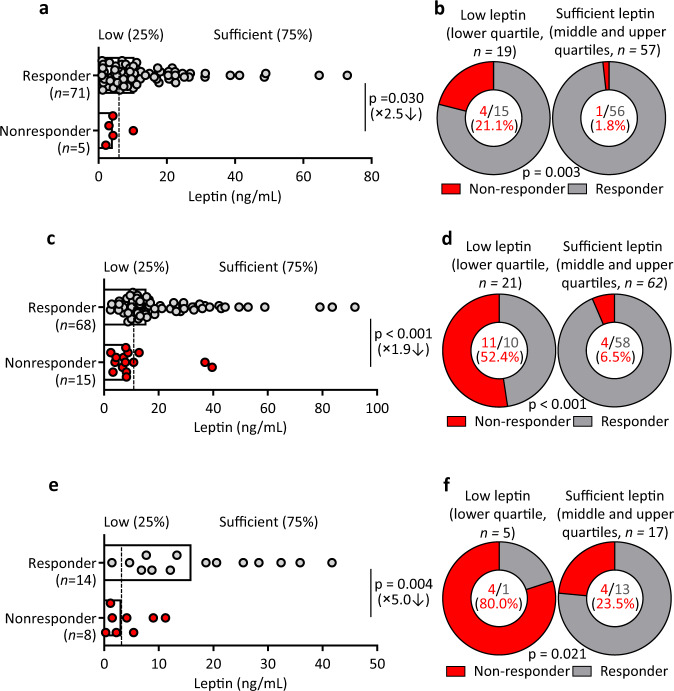
Fig. 1. Low leptin levels are associated with lower antibody responses after vaccination in the general population.
a Comparison of serum leptin levels between responders (n = 71, grey) and non-responders (n = 5, red) in healthy adults (18–60 years, n = 76) immunized with the influenza vaccine. Dotted line indicates healthy individuals with low leptin levels (lower 25%, <4.8 ng/mL) and sufficient leptin levels (higher 75%, ≥4.8 ng/mL). b Comparison of response rates between low leptin (n = 19) and sufficient leptin (n = 57) groups. c Comparison of serum leptin levels between responders (n = 68, grey) and non-responders (n = 15, red) in healthy elderly adults (>65 years, n = 83) immunized with the influenza vaccine. Dotted line indicates healthy individuals with low leptin levels (lower 25%, <8.8 ng/mL) and sufficient leptin levels (higher 75%, ≥8.8 ng/mL). d Comparison of response rates between low leptin (n = 21) and sufficient leptin (n = 62) groups. e Comparison of serum leptin levels between responders (n = 14, grey) and non-responders (n = 8, red) in healthy young adults (18–25 years, n = 22) immunized with the HBV vaccine. Dotted line indicates healthy individuals with low leptin levels (lower 25%, <3.2 ng/mL) and sufficient leptin levels (higher 75%, ≥3.2 ng/mL). f, Comparison of response rates between low leptin (n = 8) and sufficient leptin (n = 14) groups. Data from individuals (dots) and the median values (bars) are shown for a, c and e; Mann–Whitney test was used for analysis (a, c, e). Percentages and numbers are shown for b, d and f; Chi-Square tests were used for analysis (b, d, f). Detailed demographics of each cohort are shown in Supplementary Tables 1-3. For correlation of leptin levels and antibody responses see Supplementary Fig. 1.

