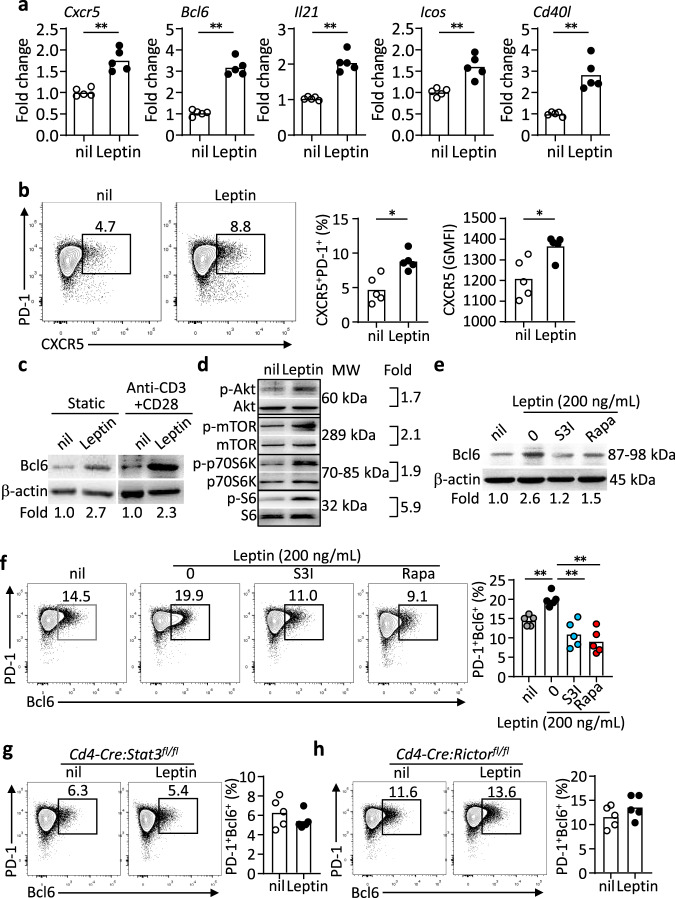
Fig. 6. Stat3 and mTOR are dispensable for leptin-induced TFH differentiation and Bcl6 expression.
a Real-time PCR analysis of mouse TFH-related genes in naïve CD4+ T cells from WT mice stimulated with anti-CD3/CD28 for 2 days, further treated with leptin for 12 h (Cxcr5: **P = 0.0029, Bcl6: **P = 0.0004, Il21: **P = 0.0007, Icos: **P = 0.0028, Cd40l: **P = 0.0023) (n = 5). b Representative FACS plots and statistics of CXCR5+PD-1+ TFH cells in cultured naïve CD4+ T cells from WT mice with anti-CD3/CD28 stimulation for 48 h, followed with or without leptin treatment for 12 h (Ratio: *P = 0.0200, GMFI: *P = 0.0243). c–e Western blot assay of Bcl6 with or without anti-CD3/CD28 activation (c), the phosphorylation of Akt, mTOR, p70S6K and S6 (d) and Bcl6 expressions in WT naïve CD4+ T cells with Stat3 inhibition (S3I-201, 100 μM), mTOR inhibition (Rapamycin, 200 nM) plus leptin (200 ng/mL) treatment for 12 h (e). Values showing the fold changes relative to the non-treated control. f Representative FACS plots and statistics of PD-1+Bcl6+ TFH cells in cultured naïve CD4+ T cells from WT mice with anti-CD3/CD28 activation for 2 days, followed with Stat3 inhibition (S3I-201, 100 μM), mTOR inhibition (Rapamycin, 200 nM) plus leptin (200 ng/mL) treatment for 12 h (0 vs nil: **P = 0.0004, S3I vs 0: **P = 0.0023, Rapa vs 0: **P = 0.0026) (n = 5). g, h Representative FACS plots of PD-1+Bcl6+ TFH cells in cultured naïve CD4+ T cells from Cd4-Cre:Stat3fl/fl mice (g) and Cd4-Cre:Rictorfl/fl mice (h) with anti-CD3/CD28 activation for 2 days, followed with or without leptin (200 ng/mL) treatment for 12 h (n = 5). Data are shown for individuals (dots) and mean (bars) values, and analysed by Mann–Whitney U-test (a, b), or two-way ANOVA (f). *P < 0.05, **P < 0.01. Results are representative of three independent experiments.

