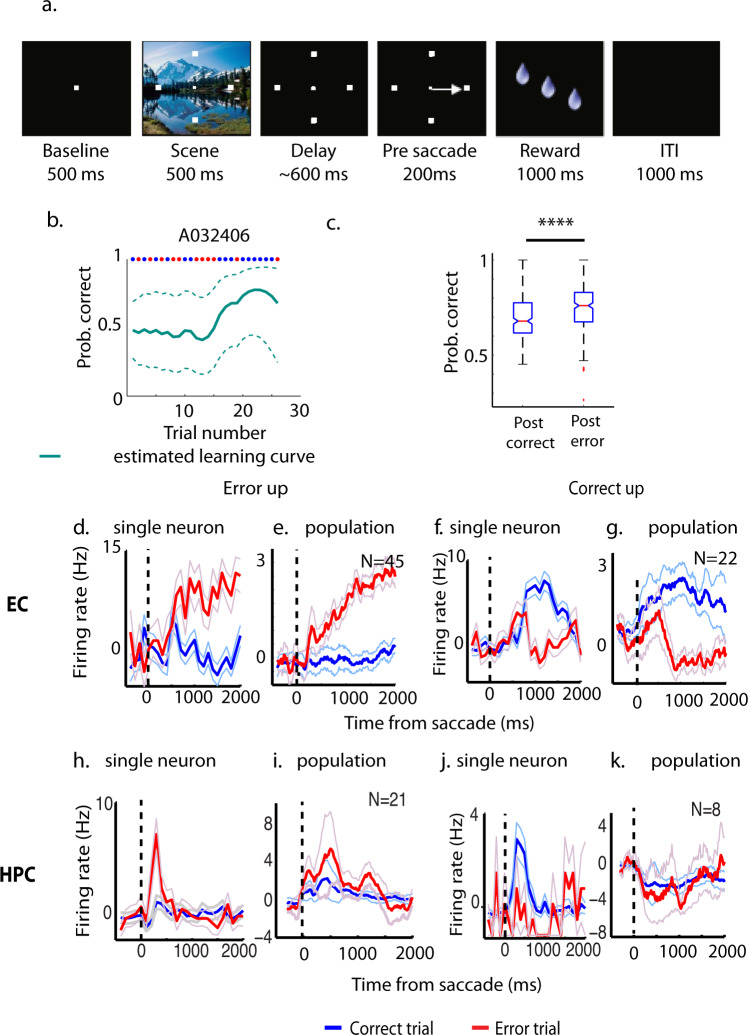
Fig. 1. Location-scene task (LST), performance, and outcome-selective signals.
a Schematic illustration of the LST. b Estimated performance of one example LST session. The red dots at the top of the graph indicate error trials and the blue dots indicate correct trials. The teal dashed lines indicated the 95% confidence intervals of the estimate. Prob.: probability c Averaged performance immediately after error trials is significantly better than after correct trials during LST (averaging across 282 sessions, 5 monkeys. Central red marks indicate the median, and the bottom and top edges of the boxes indicate the 25th and 75th percentiles, respectively. The whiskers extend to the most extreme data points not considered outliers, and the outliers are plotted individually using the “+” symbol. Notches of the boxes indicate the 95% confidence intervals of the estimated median. Individual data points are shown in Supplementary Fig. 7a and data points are listed in Supplementary Data 1). d Time courses of one representative error-up cell in EC. The time courses are averaged across either error trials (red) or correct trials (blue). e Averaged and normalized time courses of population EC error-up cells. f Time courses of one representative correct-up cell in EC. g Averaged and normalized time courses of population EC correct-up cells. h Time courses of one representative error-up cell in HPC. i Averaged and normalized time courses of population HPC error-up cells. j Time courses of one representative correct-up cell in HPC. k Averaged and normalized time courses of population HPC correct-up cells. ****p < 0.0001. The light-blue and light-red lines indicate the SD of averaged time courses.

