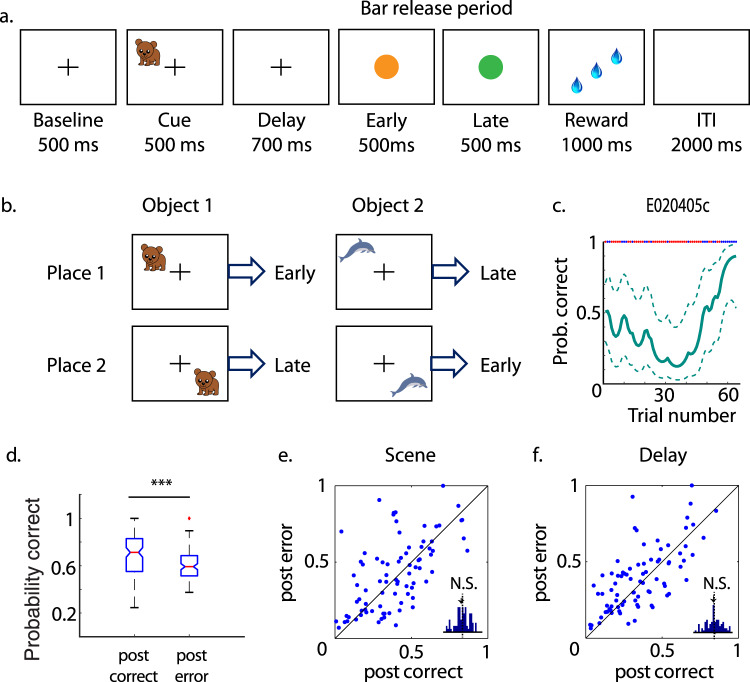
Fig. 3. Object-place task (OPT), performance, and selectivity index (SI).
a Schematic illustration of the OPT. b Illustration of the object-place response contingencies used each day. c Estimated performance of one example OPT session. The red dots at the top of the graph indicate error trials and the blue dots indicate correct trials. The dashed lines indicate the 95% confidence intervals. d The averaged performance immediately after correct trials (0.7 ± 0.017) is significantly better than after error trials (0.61 ± 0.01) for the OPT (***p < 0.001, t-test. The labels of the boxplots are the same as in Fig. 1c. Individual data points are shown in Supplementary Fig. 7b). The SI immediately after error trials is not significantly different from after correct trials during either the scene (e) or delay (f) period of the task. All data points are shown in Supplementary Data 1.

