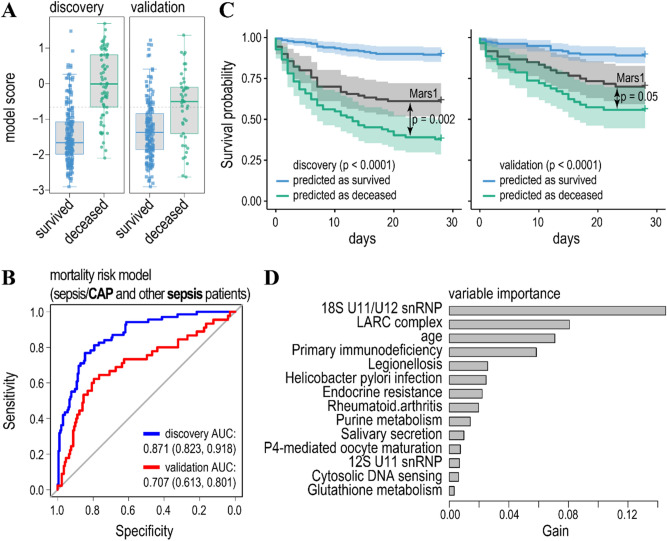
Figure 3.
The model predicting mortality/survival of sepsis (grouped as sepsis/CAP and other sepsis) patients. (A) Boxplots of the model scores predicting mortality/survivorship in the discovery (left) and validation (right) cohorts. The model was trained on the same data as the published discovery cohort by the gradient boosted regression tree and validated on an independent cohort8. Dashed lines indicate threshold levels of classification. The threshold was calculated by maximizing a product of the specificity and sensitivity of the model prediction in the discovery cohort. Further details of model accuracy are given in Tables 2 and S2. (B) Receiver operating characteristic curves (ROC) for the model predicting mortality (endpoint—survival or death within 28 days after treatment) in sepsis (grouped as sepsis/CAP and other sepsis) patients (blue line—discovery cohort, red line—validation cohort). Features were selected by the t-test comparing gene ensemble noise between the survived and deceased patients in the discovery cohort to achieve maximum prediction accuracy for the discovery cohort. Values for the area under the ROC curve (AUC) are indicated. (C) Survival probability for the patients predicted to have low (blue line) and high (green line) risk of mortality for the discovery (left panel) and validation (right panel) cohorts. P-values indicate significant differences in hazards for the predicted classes (survival/mortality) according to the Cox proportional-hazards model. Black lines—survival probability of patients with Mars1 endotype8 was compared with the predicted deceased class for the discovery and validation cohorts. (D) Variable importance of the model ranks gene ensemble noise features according to their relative contribution (gain).

