Figure 6.
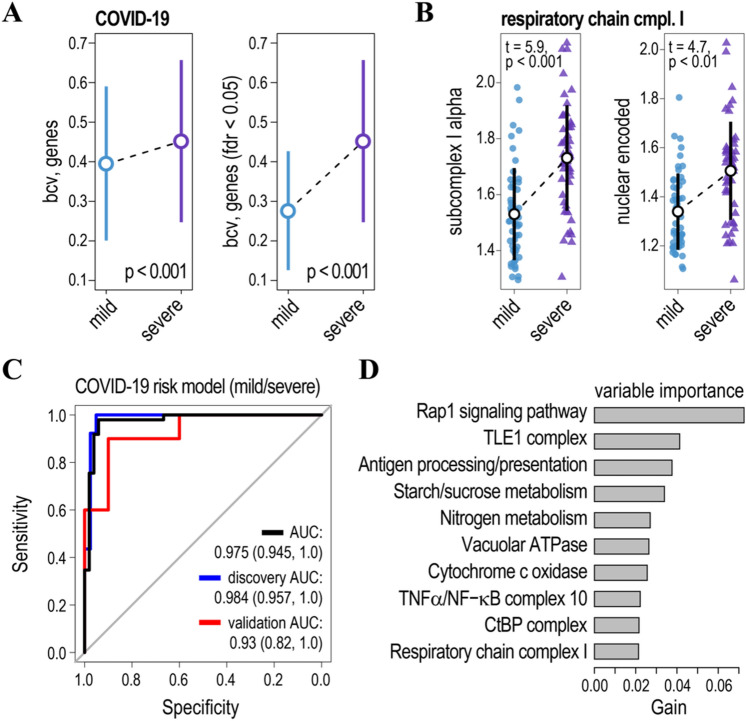
Association of gene ensemble noise with the COVID-19 disease state. (A) Inter-individual biological variability in leukocyte gene expression (bcv—biological coefficient of variation) increases in severe COVID-19 patients as compared to the mild ones. Left panel—average estimates of the bcv for all genes expressed in the patients’ leukocytes, right panel—bcv for the genes with significant changes in inter-individual biological variability (false discovery rate, FDR < 0.05). p-values of t-tests comparing differences in inter-individual gene expression variability for mild and severe COVID-19 patients. Circles and whiskers indicate means and standard deviations respectively. (B) Plots of gene ensemble noise for genes encoding subunits of mitochondrial respiratory chain complex I (subcomplex I alpha—left panel and nuclear-encoded subunits—right panel). Black circles and whiskers indicate means and standard deviations. t and p-values of the tests comparing gene ensemble noise for mild and severe COVID-19 patients are shown. (C) ROC curves for the model based on the gene ensemble noise for the discovery (blue line) and validation (red line) cohorts, and all samples (black line). For further details on the model accuracy see Tables 2 and S4. (D) Relative contribution of gene ensemble noise features to the model. For further details see Table S5.

