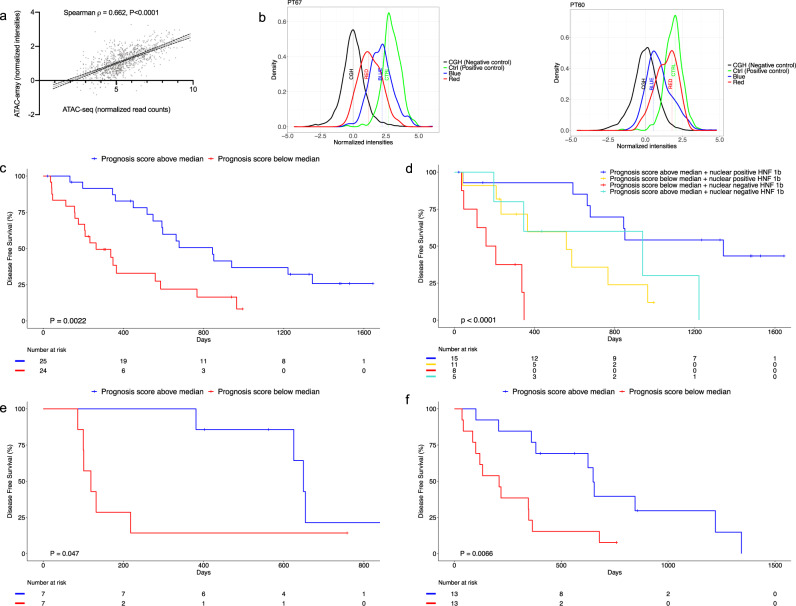
Fig. 4. ATAC-array correlates with ATAC-seq and predicts DFS.
a ATAC-seq and ATAC-array correlation is shown in a representative patient (PT17). b Representative histograms showing good (blue distribution median intensity > red) prognosis and poor (red distribution median intensity > blue) prognosis ATAC-array signature in patient PT67 and PT60, respectively. (Source data are provided as a Source Data file). c Kaplan–Meier curve showing significant segregation of PDAC patients (n = 49) on the basis of ATAC-array prognosis score (log-rank (Mantel–Cox) test P = 0.0022, HR 2.896, 95% CI 1.426 to 5.878). d Kaplan–Meier curve shows combination of ATAC-array and HNF1b nuclear localization segregates PDAC patients into four different groups with significantly different median DFS (log-rank (Mantel–Cox) test P < 0.0001, and log-rank test for trend P < 0.0001). e Kaplan–Meier curve showing significant segregation of PDAC organoids on the basis of ATAC-array Prognosis Score in an independent validation cohort (n = 14) (log-rank (Mantel–Cox) test P = 0.0475, HR 3.228, 95% CI 0.8523 to 12.23). f Kaplan–Meier curve showing significant segregation of PDAC organoids on the basis of ATAC-array Prognosis Score in the pooled cohort (n = 26) (log-rank (Mantel–Cox) test P = 0.0066, HR 2.860, 95% CI 1.144 to 7.145) (Source data are provided as a Source Data file).

