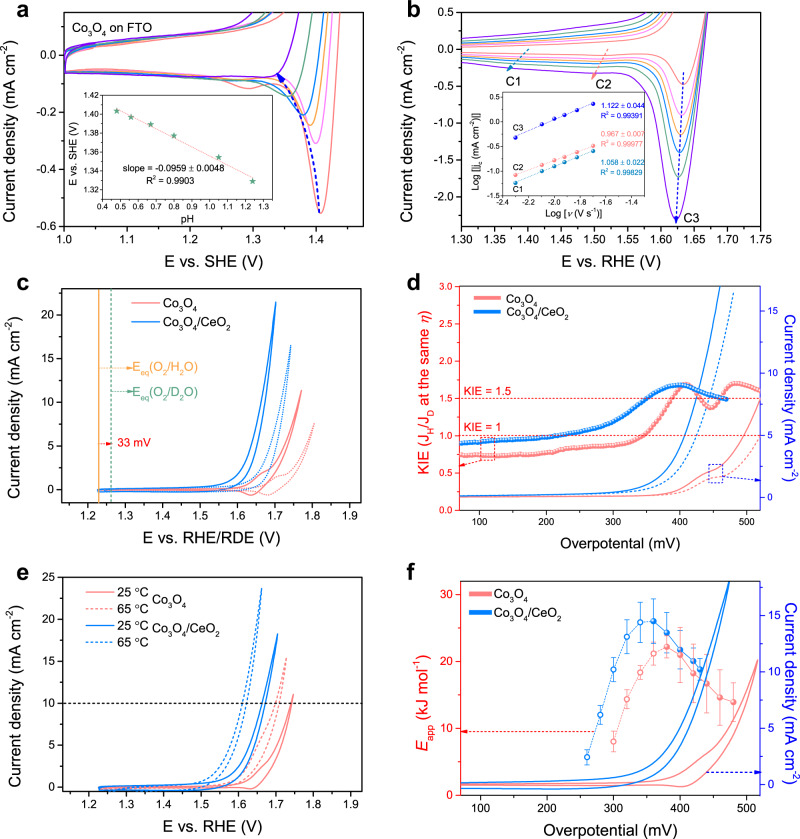
Fig. 3. The pH-dependence, kinetic isotope effect (KIE) and apparent activation energy (Eapp) analyses of the acidic OER on Co3O4 and Co3O4/CeO2 catalysts on FTO electrodes.
a CV curves of Co3O4 recorded in H2SO4 solutions with different pH values, the inset shows the C3 peak potential vs. SHE plotted against the solution pH. b CV curves of Co3O4 recorded at different scan rates in 0.5 M H2SO4 solution, the inset shows the logarithm of cathodic peak current density (jc) plotted against the logarithm of scan rate (ν). c CV curves of both catalysts recorded in 0.5 M H2SO4 in H2O solution on the RHE scale (solid) vs. in 0.5 M D2SO4 in D2O solution on the RDE scale (dashed). d The KIE curves plotted with the LSV curves adapted from (c) but presented on the overpotential scale. e CV curves of both catalysts recorded in 0.5 M H2SO4 solution at 25 vs. 65 °C. f The corresponding Eapp data point and error bar are calculated from CV curves recorded at different temperatures (see Supplementary Fig. 18 for details).

