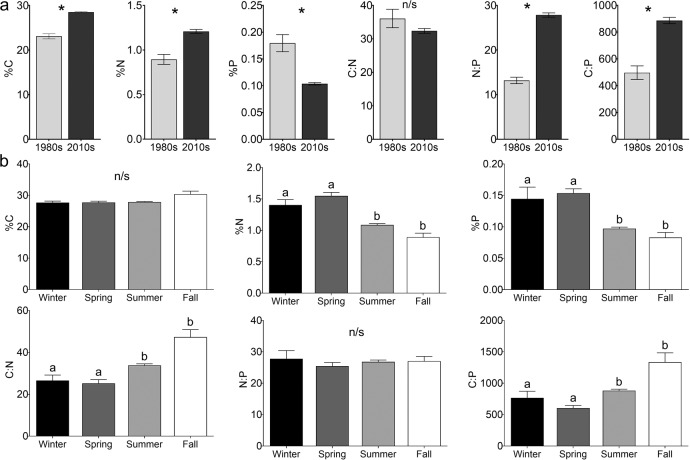
Fig. 2. Sargassum tissue nutrient contents.
Tissue elemental composition and C:N:P stoichiometry (mean ± SE) of Sargassum natans and S. fluitans collected throughout the NA in the 1980s and post-2010. a by decade with asterisks representing significant differences and b by Northern Hemisphere meteorological season with different lowercase letters representing significant differences identified with Tukey HSD test; “n/s” denotes a non-significant (P > 0.05) ANOVA result.

