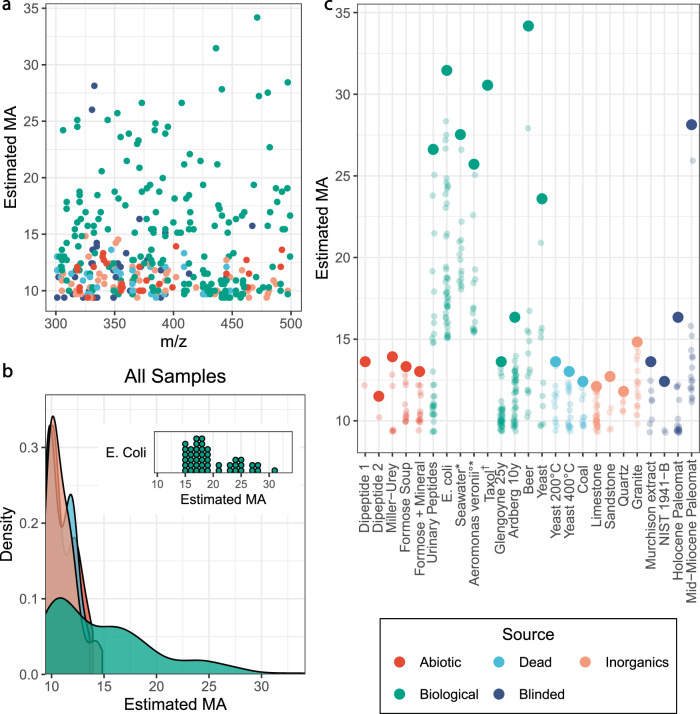
Fig. 4. Estimated MA of laboratory and environmental samples.
a The estimated MA against the parent mass of many ions for different samples in the 300–500 m/z range (excluding Taxol with has a m/z value of 854.9). b The distributions of estimated MA for all samples split by category, colored by source, the inset shows the distribution of points for a single biological sample, E. Coli. The MA of biological samples has a wider distribution, showing that only biologically produced samples produce MA above a certain threshold. c The estimated MA values for each sample with the blinded identities correctly labeled. The highest MA value in each sample is bold and the lower values faded. Each sample may have more than 15 points due to the dynamic exclusion settings used, which enable us to collect more MS2 peaks. Samples may have less than 15 points due to excluding noisy or unreliable spectra, for more information see Supplementary Information Section 5. *These samples were run with a column attached to the mass spectrometry but no chromatographic method was used. °This sample was gathered from an online database and analyzed with a different instrument. † Taxol is shown in Fig. 4C but has a mass that is not shown in Fig. 4A or 5B. See Supplementary Information Section 6 for details.

