
Figure 4.
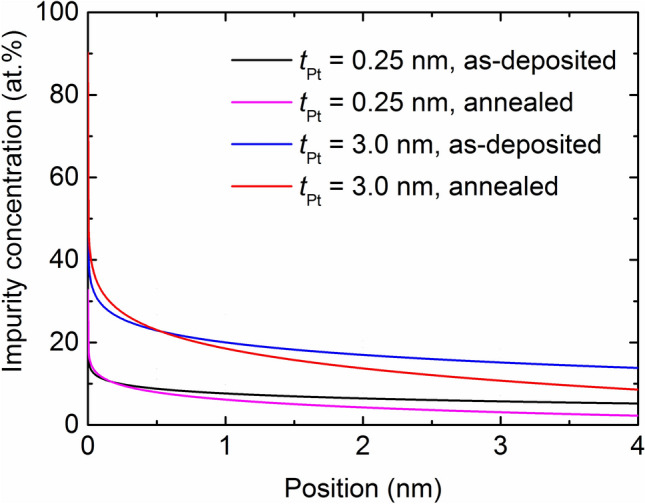
Results for the impurity (Pt or Ru or both) contents as a function of the position in the Co region at Pt thicknesses of 0.2 nm and 3.0 nm in the as-deposited and annealed samples.
Official websites use .gov
A
.gov website belongs to an official
government organization in the United States.
Secure .gov websites use HTTPS
A lock (
) or https:// means you've safely
connected to the .gov website. Share sensitive
information only on official, secure websites.
Results for the impurity (Pt or Ru or both) contents as a function of the position in the Co region at Pt thicknesses of 0.2 nm and 3.0 nm in the as-deposited and annealed samples.