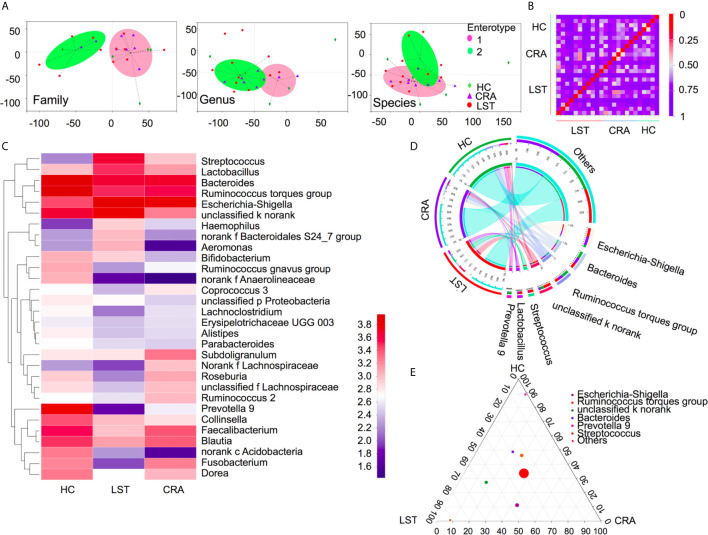
Figure 2.
Variations of mucosal microbiota composition in LST. (A) Entero-typing analysis on family, genus and species groups in the HC (n = 5), CRA (n = 8), and LST group (n = 11). The green diamond represented the HC group. The purple triangle represented the CRA group and the red dot represented the LST group. The pink dot represented the enterotype 1 while the green dot represented the enterotype 2. (B) Distance heatmap in samples on genus level. (C) Heatmap in the three groups on genus level. (D) Cicros analysis on genus in three groups. (E) Tertiary analysis on genus level in three groups.

