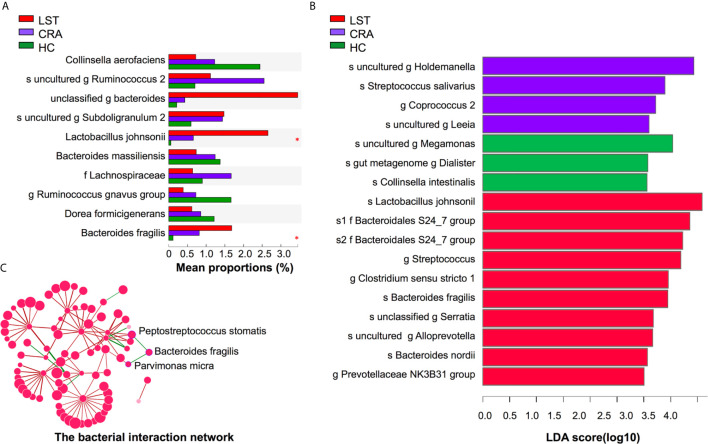
Figure 3.
Variations of mucosal microbiota composition on species level in LST. (A) Kruskal-Wallis test analysis on species level in the three groups. The X axis represented the mean proportions (%) of species in three groups. Lactobacillus johnsonii and Bacteroides fragilis presented high abundance in the LST group. (B) LDA analysis on species level in the three groups. The X axis represented LDA score of species in three groups. Lactobacillus johnsonii and Bacteroides fragilis significantly over-presented in the LST group. (C) The interaction network among Bacteroides fragilis and other bacteria. The abundance of Bacteroides fragilis was positively related with the abundance of Peptostreptococcus stomatis and Parvimonas micra. LDA, linear discriminant analysis; HC, healthy control; CRA, colorectal adenoma; LST, laterally spreading tumor. *P < 0.05.

