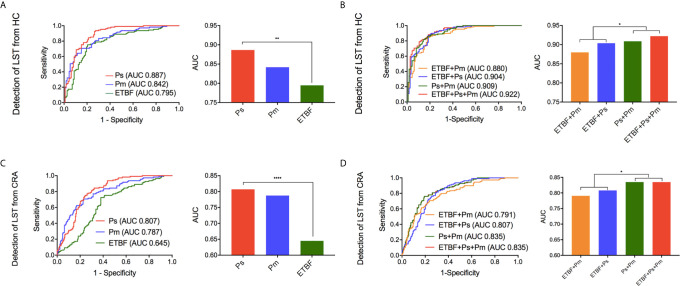
Figure 5.
The diagnostic performance of marker ETBF, P. stomatis, P. micra, and combined test by ROC curve analysis. (A) Differentiating LST from HC, the ROC curves and AUCs (Delong’s test) of the three bacteria. (B) Differentiating LST from HC, the ROC curves and the AUCs (Delong’s test) of the promising diagnostic bacterial models. (C) Differentiating LST from CRA, the ROC curves and AUCs (Delong’s test) of the three bacteria. (D) Differentiating LST from CRA, the ROC curves and the AUCs (Delong’s test) of the promising diagnostic bacterial models. HC, healthy control; LST, laterally spreading tumor; ETBF, Enterotoxigenic Bacteroides fragilis; Ps, Peptostreptococcus stomatis; Pm, Parvimonas micra; AUC, area under the receiver-operating characteristic curve. *P < 0.05, **P < 0.01, ****P < 0.0001.

