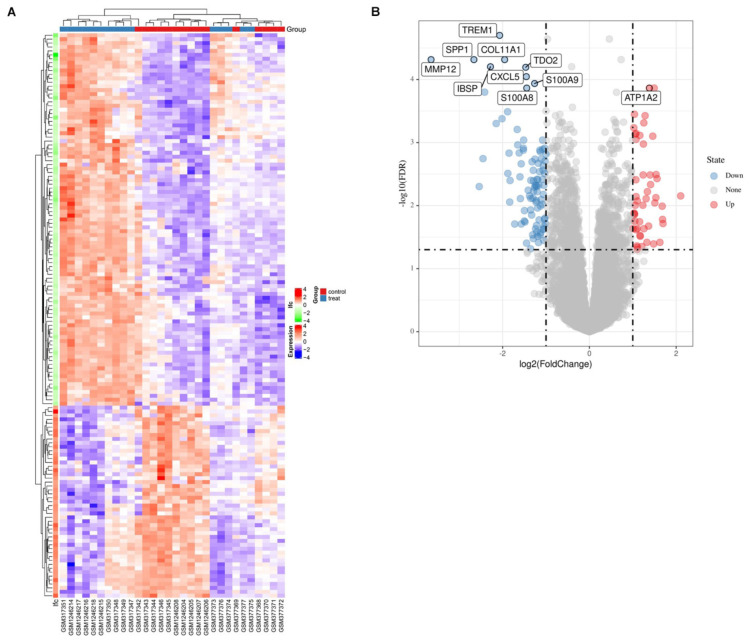
FIGURE 2.
The identification of EDGs. (A) The heat-map of differential expression genes (P < 0.05, | logFC| > 1). Up-regulated genes were in red and down-regulated genes were in blue. (B) Volcano plot of genes detected in CAVD, red dots represent upregulated genes and blue dots represent downregulated genes.

