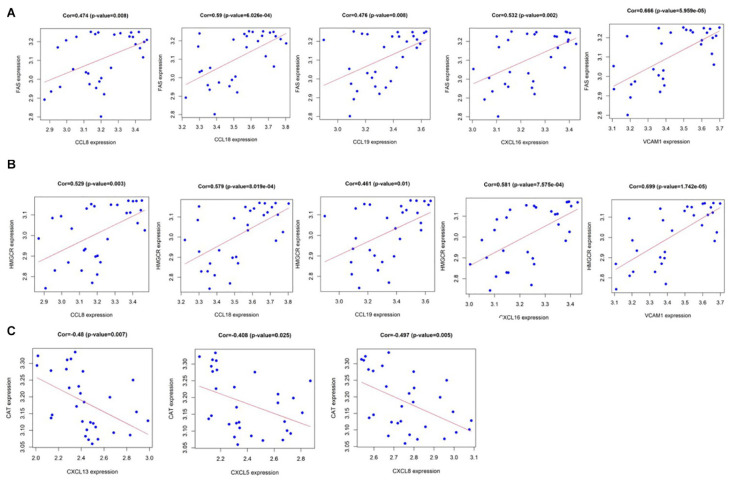
FIGURE 7.
(A) CCL8, CCL18, CCL19, CXCL16, and VCAM1 are positively correlated with fatty acid synthase (FAS); and (B) CCL8, CCL18, CCL19, CXCL16, and VCAM1 are positively correlated with hydroxymethylglutaryl coenzyme A reductase (HMGCR). (C) CXCL13, CXCL5, and CXCL8 have a strong negative correlation with lecithin cholesterol acyltransferase (CAT). P value < 0.05.

