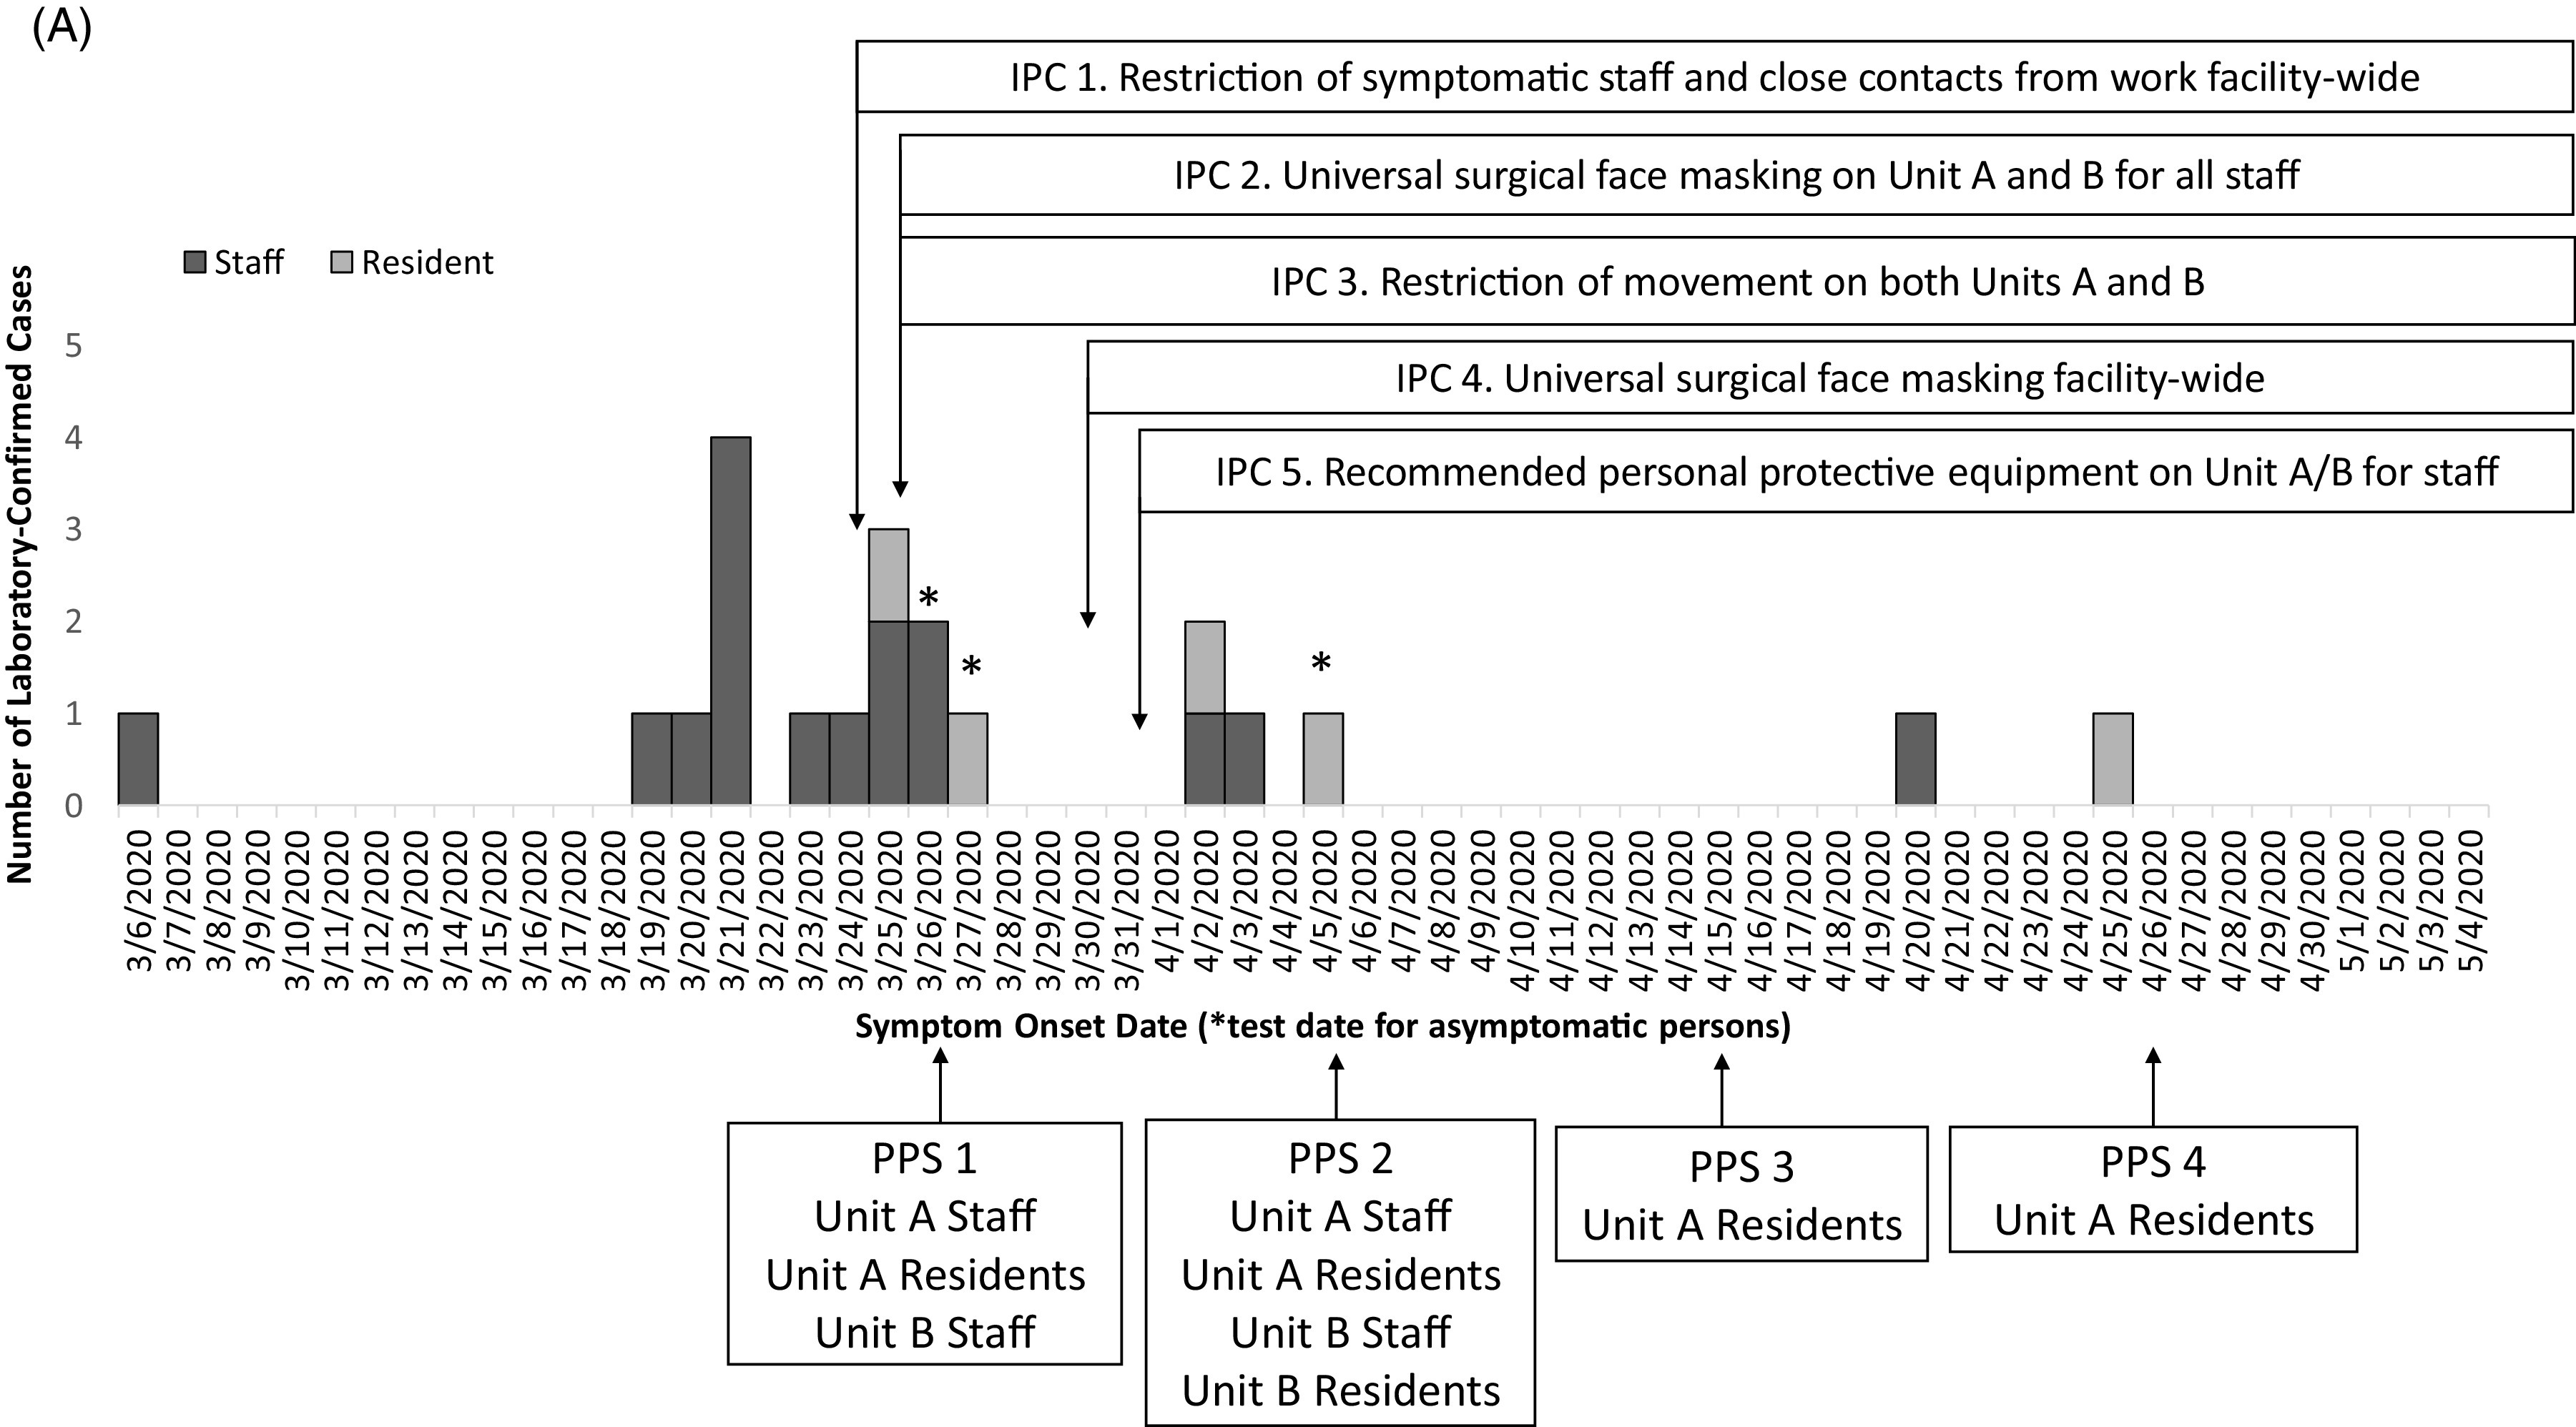
Fig. 1.

A. Epidemic curve of laboratory-confirmed COVID-19 cases with a timeline of the infection prevention and control (IPC) interventions and point prevalence surveys (PPS). Confirmed cases among staff (dark gray, n = 16) and residents (pale gray, n = 5) in the facility are plotted by symptom onset date or by test date (*), among 501 staff and 224 residents tested during this outbreak response. The x-axis also provides a timeline of the outbreak response in by test date if asymptomatic (*), IPC interventions and PPS from March 6 to May 4, 2020.
